Stock Indices:
| Dow Jones | 40,669 |
| S&P 500 | 5,569 |
| Nasdaq | 17,446 |
Bond Sector Yields:
| 2 Yr Treasury | 3.60% |
| 10 Yr Treasury | 4.17% |
| 10 Yr Municipal | 3.36% |
| High Yield | 7.69% |
YTD Market Returns:
| Dow Jones | -4.41% |
| S&P 500 | -5.31% |
| Nasdaq | -9.65% |
| MSCI-EAFE | 12.00% |
| MSCI-Europe | 15.70% |
| MSCI-Pacific | 5.80% |
| MSCI-Emg Mkt | 4.40% |
| US Agg Bond | 3.18% |
| US Corp Bond | 2.27% |
| US Gov’t Bond | 3.13% |
Commodity Prices:
| Gold | 3,298 |
| Silver | 32.78 |
| Oil (WTI) | 58.22 |
Currencies:
| Dollar / Euro | 1.13 |
| Dollar / Pound | 1.34 |
| Yen / Dollar | 142.35 |
| Canadian /Dollar | 0.72 |

A proposed tariff increase on goods imported from China was delayed from October 1st to October 15th. Tariffs on a number of Chinese goods are scheduled to increase to 30 percent from 25 percent effective on the 15th.
U.S. equity markets marked their best third quarter since 1997, recapturing gains that were lost in the final quarter of 2018. The market’s resilience has allowed stock and bond prices to elevate higher even with the headwinds of trade tensions and recessionary concerns. Meager bond yields worldwide also fueled a gravitation towards stocks as investors sought more attractive yields in the form of dividends.
Domestic bond yields rose in September, climbing back from ultra low levels reached in August. The Fed’s easing rate trend is part of a larger global movement by other central banks to lower rates internationally.
Currency markets reacted to slightly higher U.S. rates in September, sending the U.S. dollar to its strongest levels in over two years. Various factors such as consistent consumer demand and a stable economic environment, relative to other global economies, helped drive the demand for the dollar.
A key inflation indicator, the Consumer Price Index (CPI), moved higher with its fastest annualized growth since 2008. The CPI index, which measures the price of various goods and services such as food, housing, and medical expenses, rose 2.4% over the past year. Medical insurance and healthcare related expenses saw some of the largest increases. (Sources: Commerce Depart., U.S. Treasury, BLS)
Equity Markets Advance In The 3rd Quarter – Domestic Equity Update
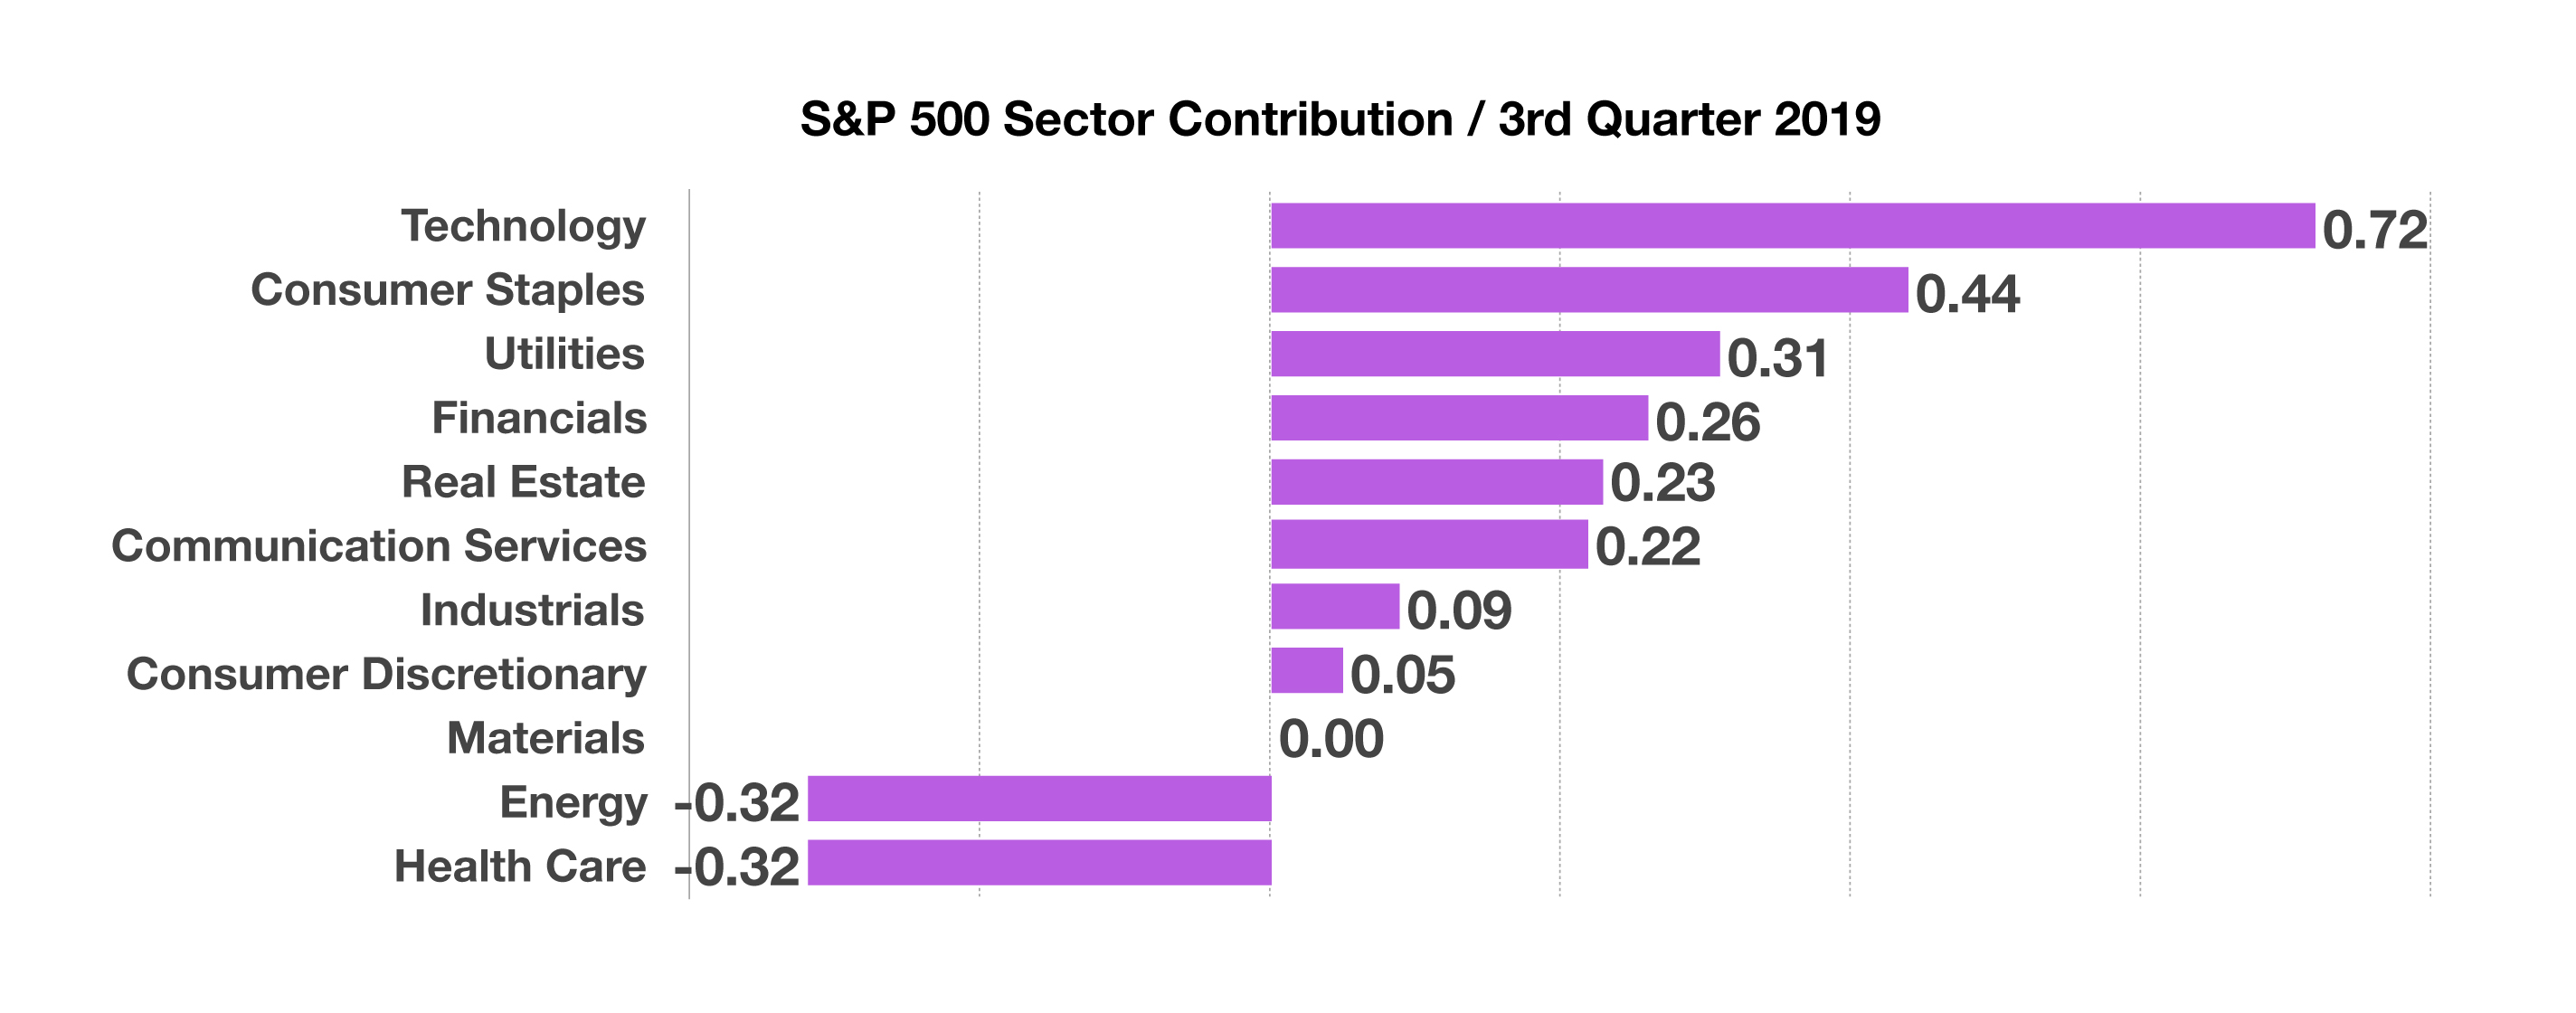
Despite ongoing trade tensions and concerns about a slowing economy, U.S. equities excelled in the third quarter, with technology, consumer staples, and utilities as the leading sectors for the S&P 500 Index. The energy and health care sectors were the under performers relative to the other 9 sectors. Equity markets are reacting more sensitively to economic indicators, such as unemployment, manufacturing, and Gross Domestic Production (GDP) data. Earnings growth for U.S. companies is starting to slow for certain sectors, as economic expansion decelerates. The corresponding chart illustrates how the various sectors contributed to the S&P 500 Index for the 3rd quarter. (Sources: BLS, Bloomberg, Reuters)
 Rates Edge Up Slightly In September – Fixed Income Overview
 Federal Deficit Projections Top $1 Trillion – Fiscal Policy Review
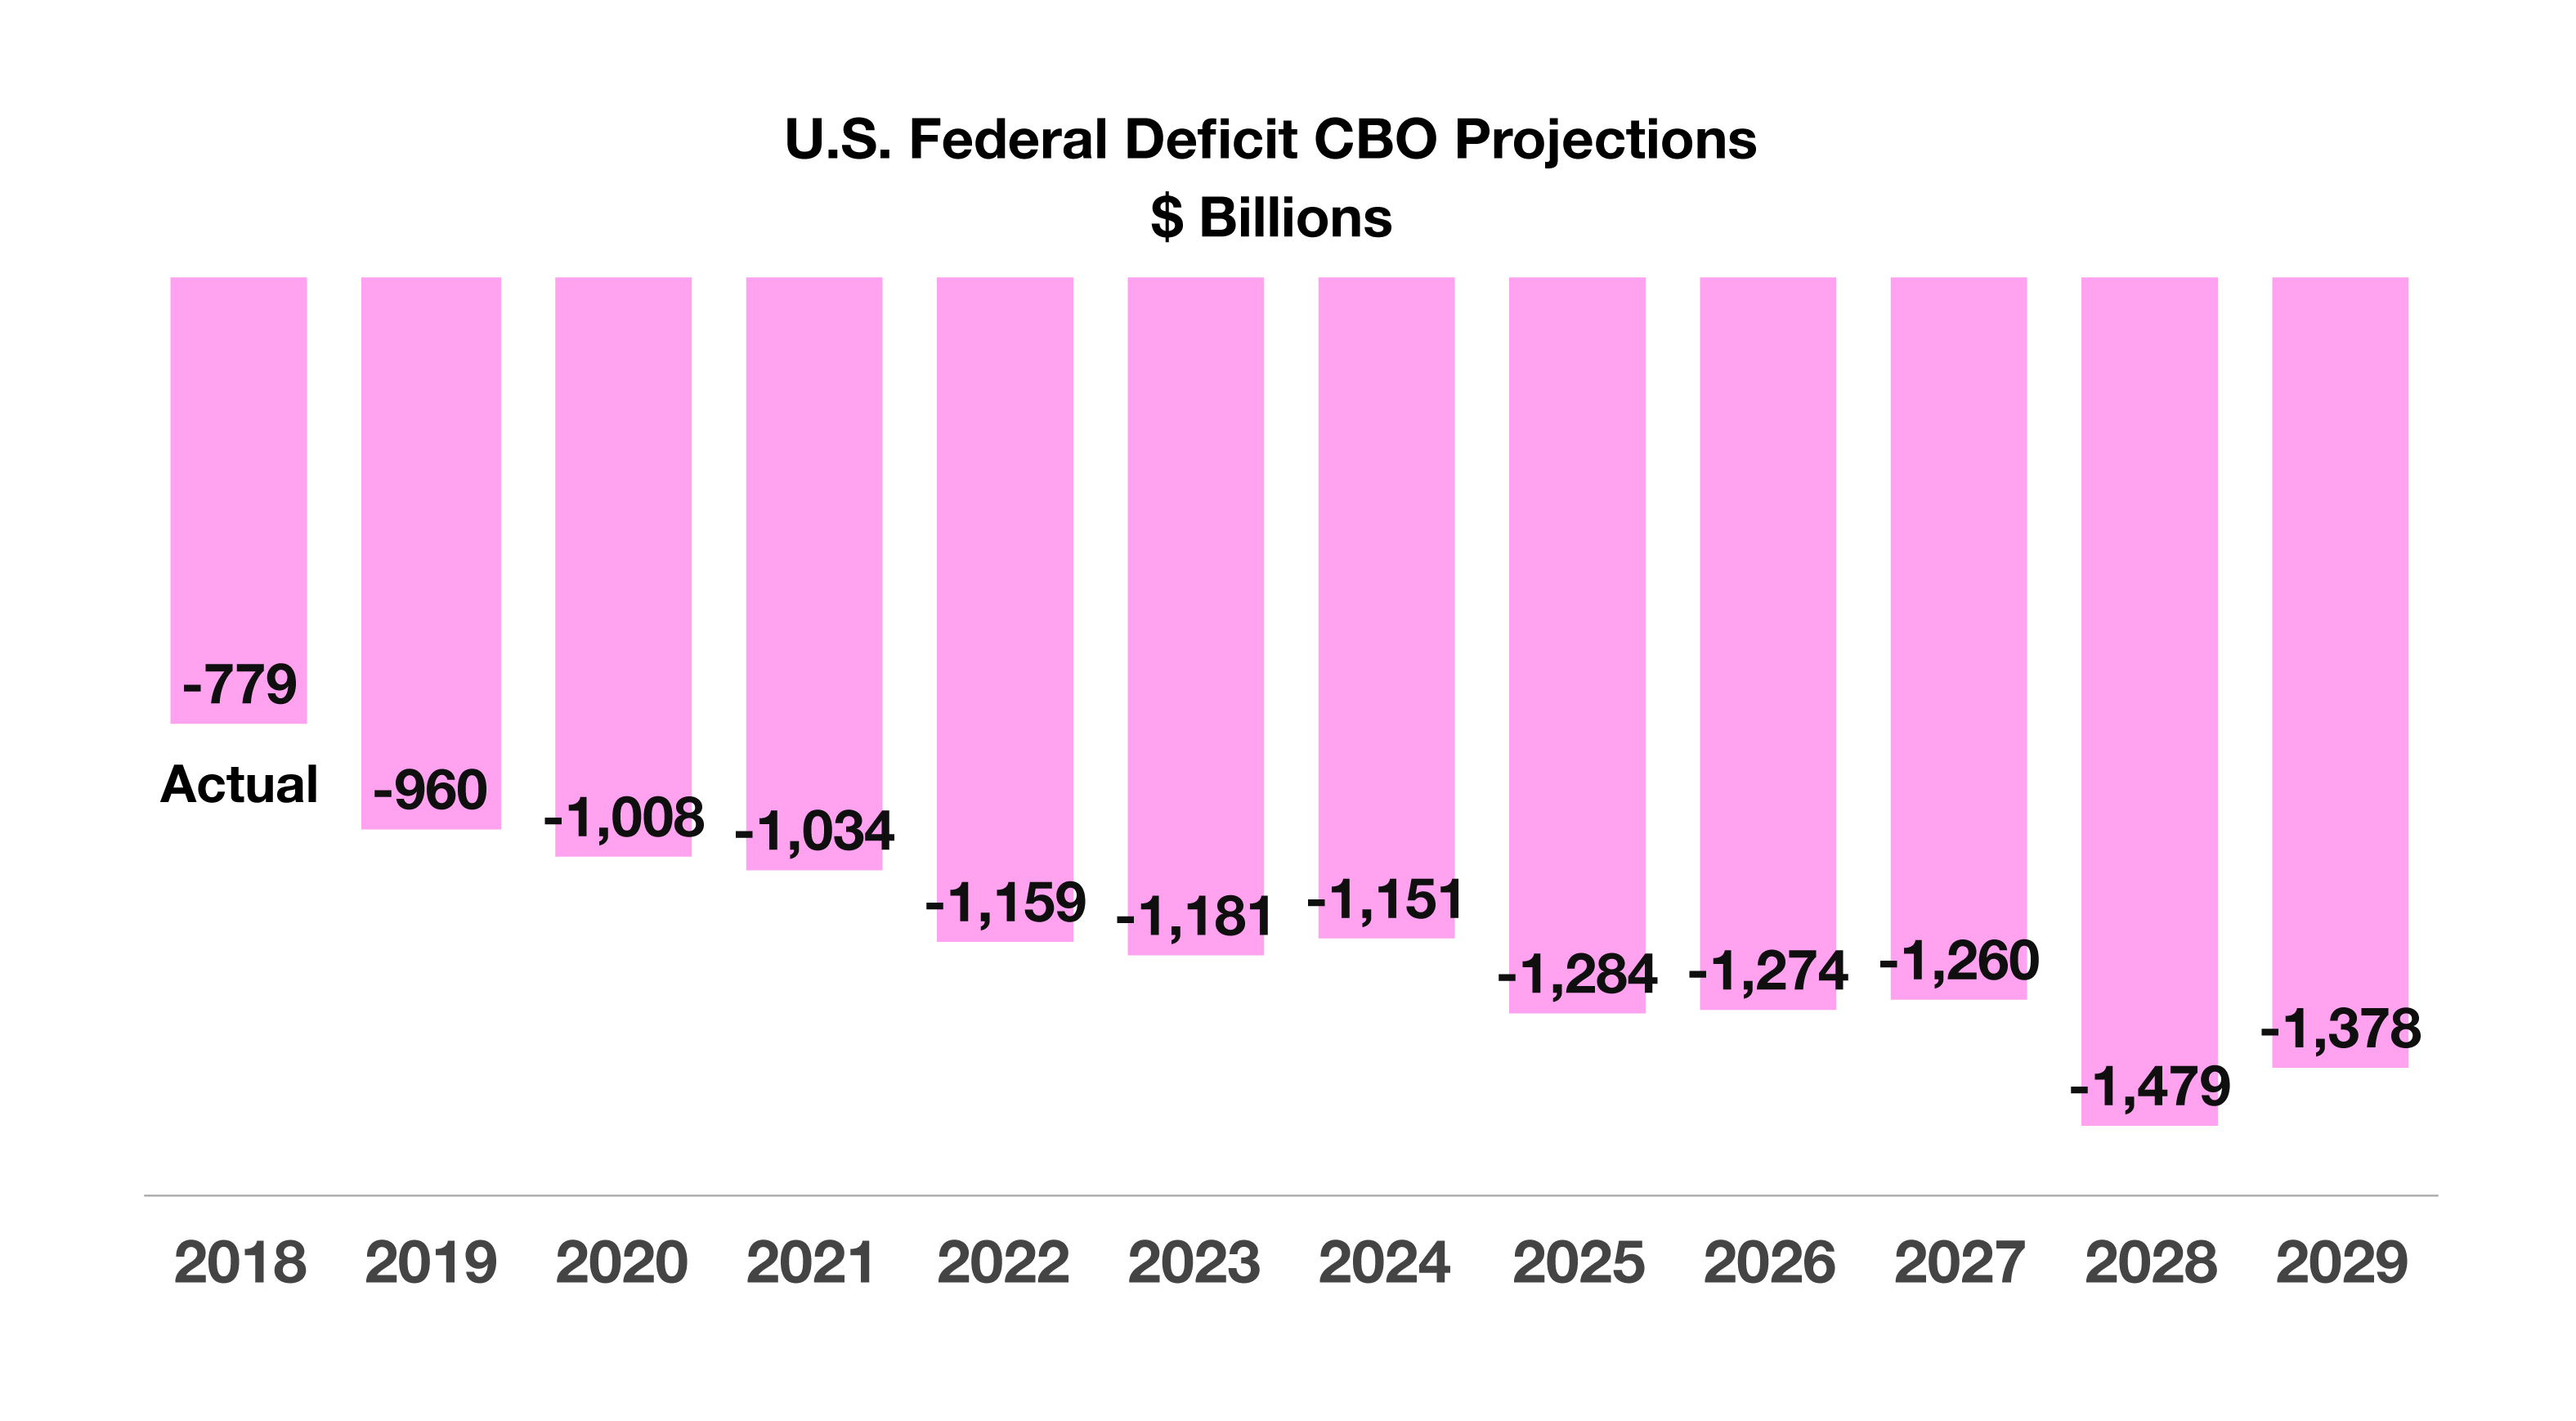 Projections over the next 10 years show an average annual budget deficit of $1.2 trillion between 2019 and 2029. The estimate represents a deficit of 4.4% to 4.8% of GDP, above the 50-year average. Even though tax revenues are estimated to grow, GDP is expected to expand at a more conservative pace. Current estimates show GDP growing at 2.3% in 2019, yet the CBO projects an average annual GDP growth rate of 1.8% over the next 10 years.
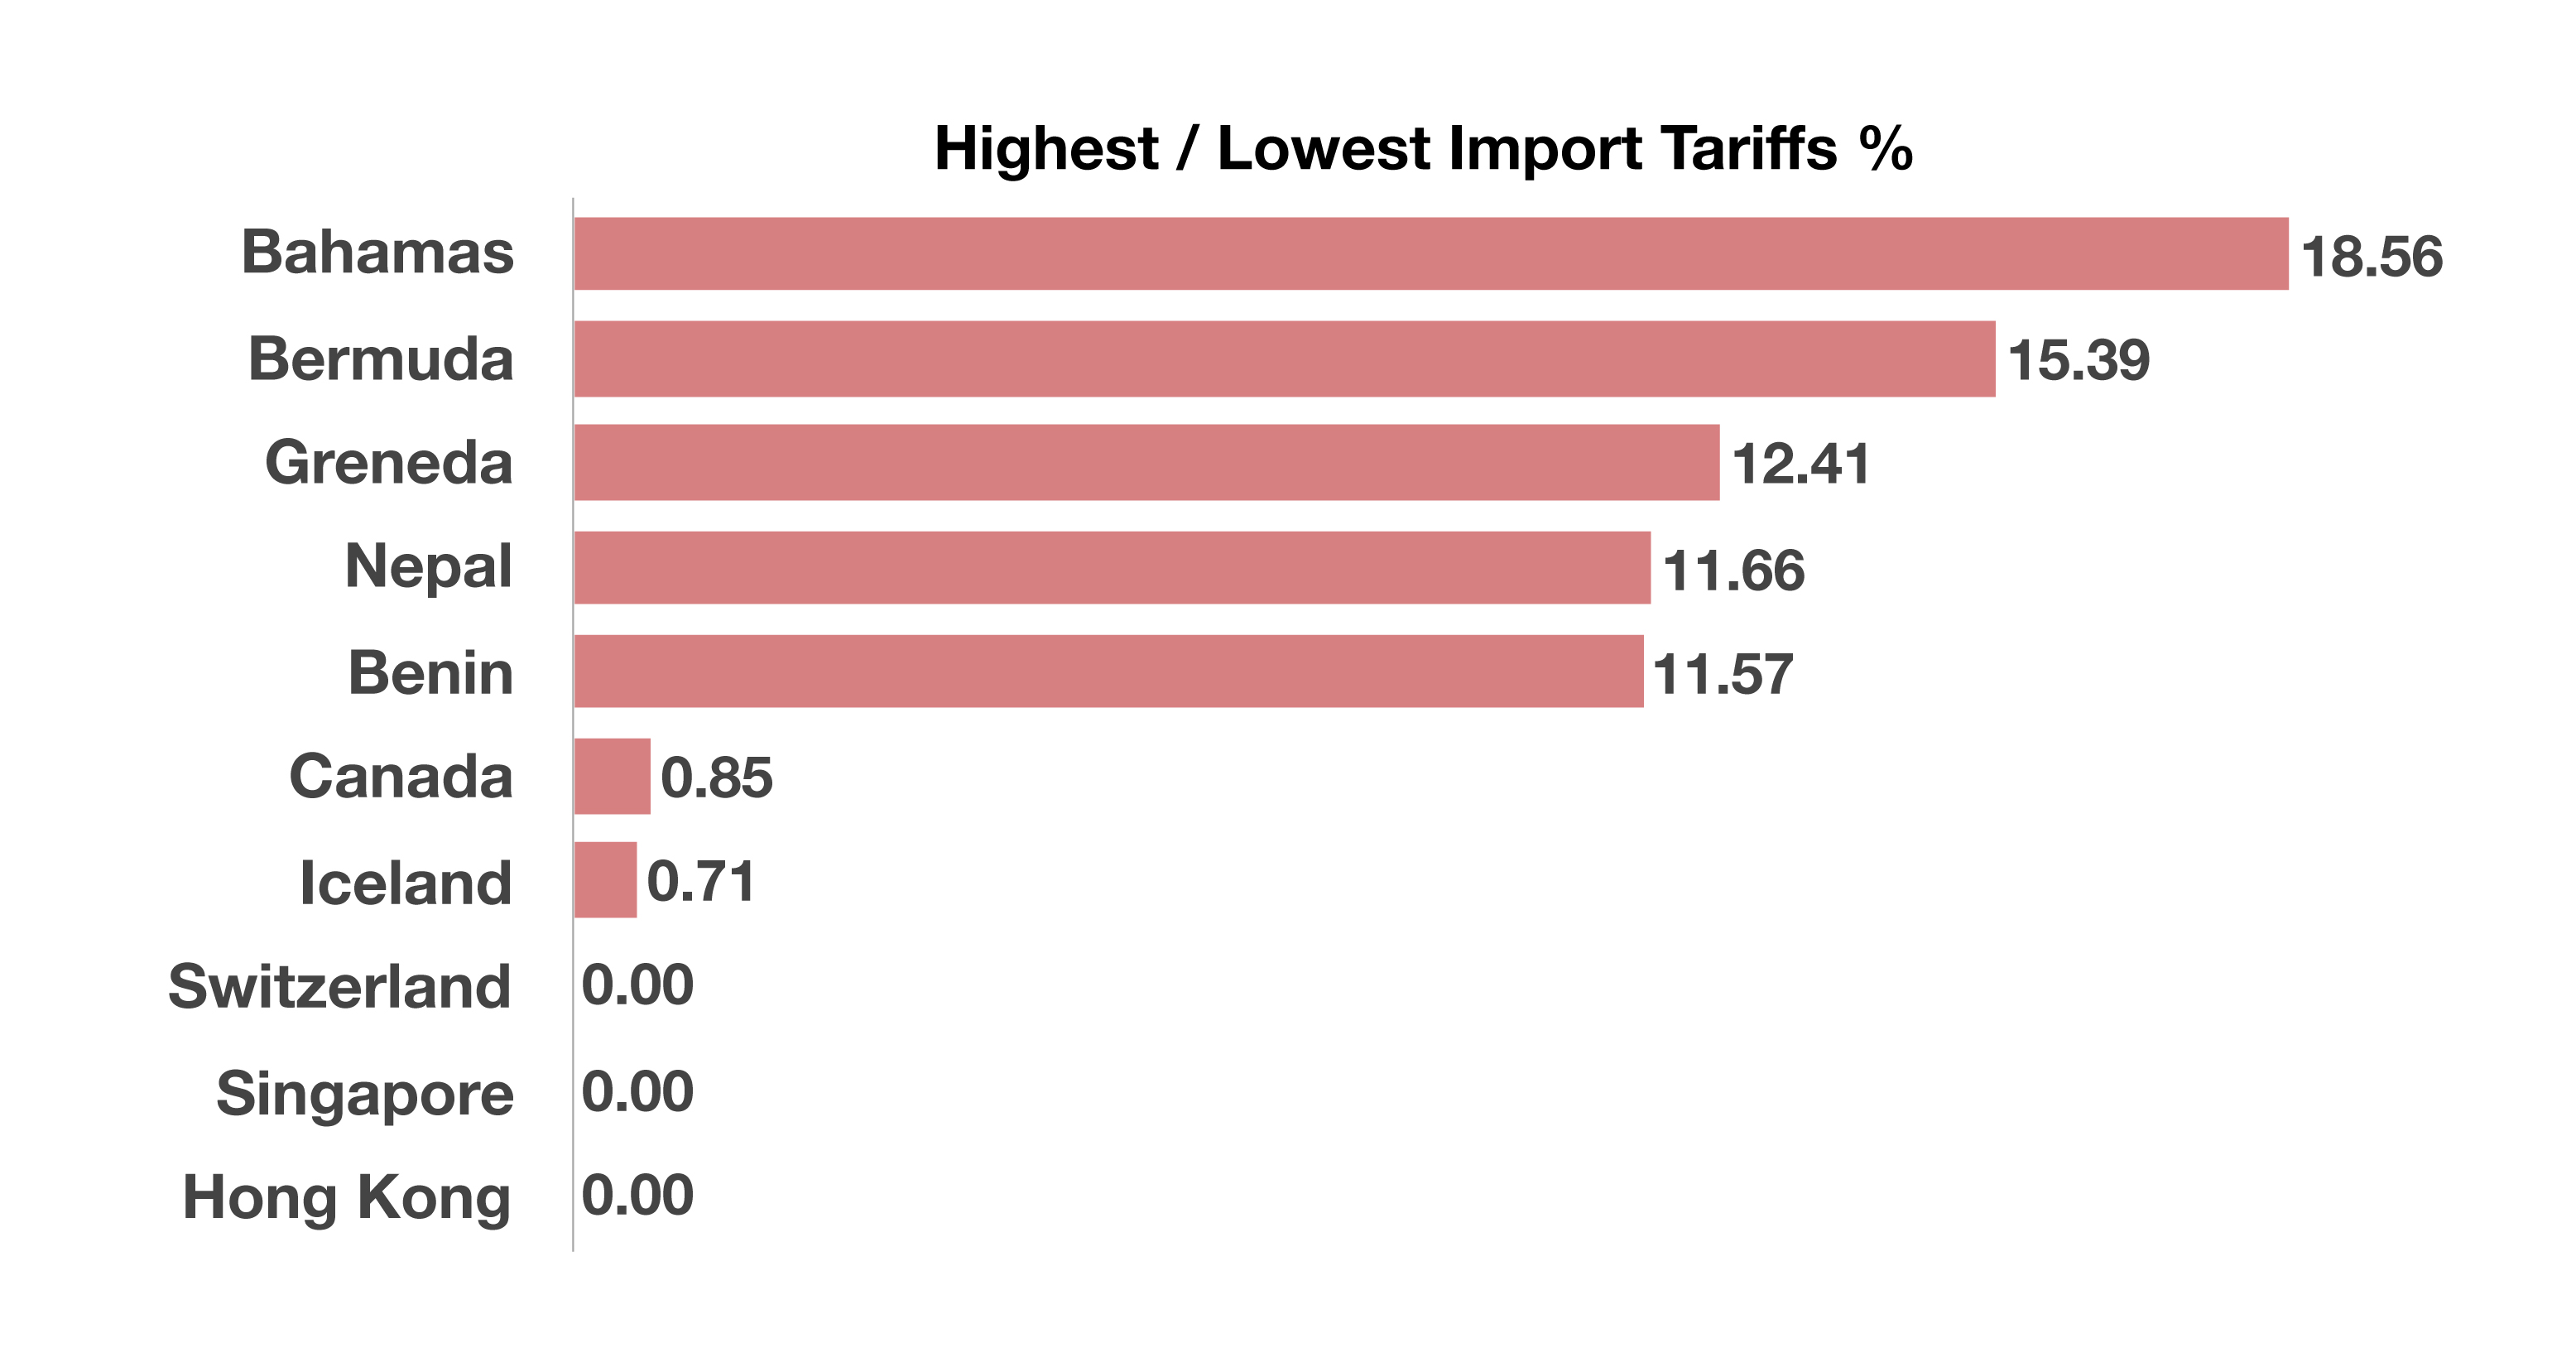 Limited resources and production capabilities may require certain countries to openly import necessary goods and raw materials with no tariffs in order to satisfy the demands of its citizens and industries. Based on data from the World Bank, Switzerland, Singapore, and Hong Kong are among those that impose no tariffs on imported products and materials. (Sources: World Bank; 2016 data, CIAWorldFactBook)
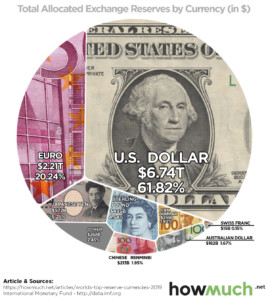 The World’s Most Powerful Reserve Currencies