Ocean Park Capital Management

2503 Main Street

Santa Monica, CA 90405

Main: 310.392.7300

Daily Performance Line:  310.281.8577

September 2020
Market Update
(all values as of 08.30.2024)

Stock Indices:

Dow Jones 41,563
S&P 500 5,648
Nasdaq 17,713

Bond Sector Yields:

2 Yr Treasury 3.91%
10 Yr Treasury 3.91%
10 Yr Municipal 2.70%
High Yield 6.92%

YTD Market Returns:

Dow Jones 10.28%
S&P 500 18.42%
Nasdaq 18.00%
MSCI-EAFE 9.72%
MSCI-Europe 9.81%
MSCI-Pacific 9.34%
MSCI-Emg Mkt 7.44%
 
US Agg Bond 3.07%
US Corp Bond 3.49%
US Gov’t Bond 2.95%

Commodity Prices:

Gold 2,535
Silver 29.24
Oil (WTI) 73.65

Currencies:

Dollar / Euro 1.10
Dollar / Pound 1.31
Yen / Dollar 144.79
Canadian /Dollar 0.74

Portfolio Overview

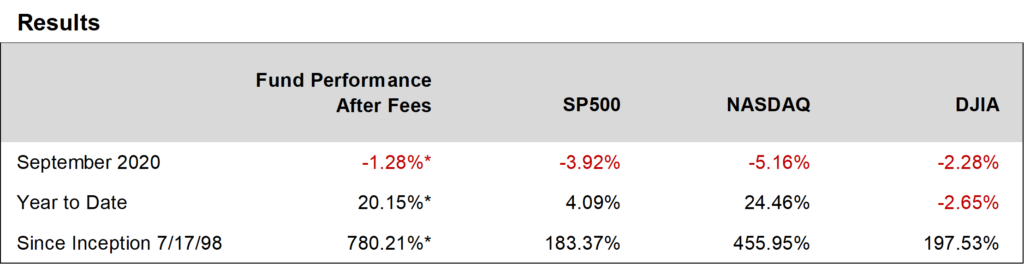
Ocean Park Investors Fund lost 1.28%* in September.  However, we outperformed the major indices, including the S&P 500 which lost 3.92%.  In addition, the fund outperformed the HFRI Equity Hedge Index, which lost 1.53%.  For the year to date through June, the fund was up 20.15%* while the S&P 500 was up 4.09% and the HFRI was up 2.24%.  Several portfolio stocks generated outsized gains, including Zoom Video (up 44%) and Bed Bath and Beyond (up 23%).

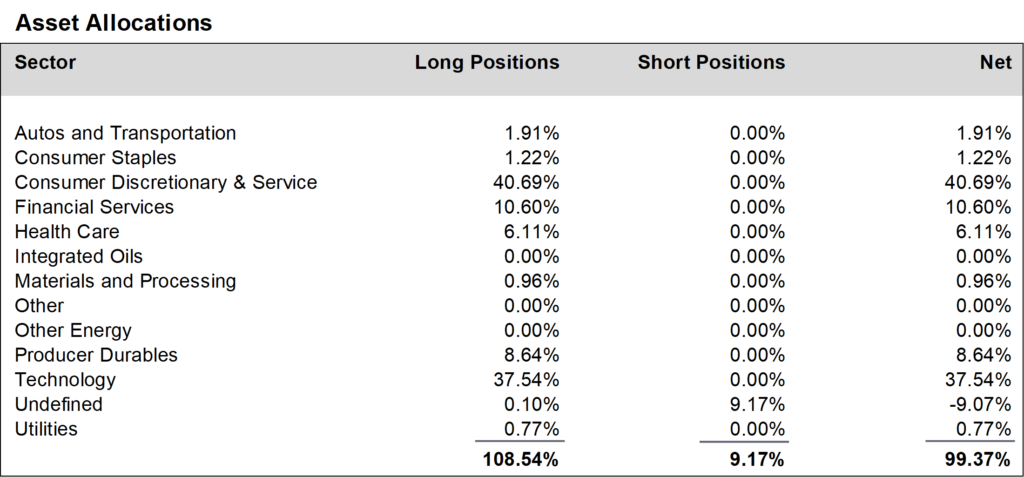
During September, we increased positions in the financial services sector and the producer durables sector.  Exclusive of our short position in QQQ options, we finished the month at about 99% net long, up from about 97% in August.  However, taking into account our QQQ short option hedges, our effective net long exposure was closer to 80%.


Daily updates on our activity are available on our Results Line, at 310-281-8577, and current information is also maintained on our website at www.oceanparkcapital.com. To gain access to the site enter password opcap.

*These results are pro forma. Actual results for most investors will vary. See additional disclosures on page 4. Past performance does not guarantee future results.

 
Equity Overview

Equity Overview

All the major indices lost ground in September and the downturn extended across all sectors except materials and utilities. The energy sector was the worst performer, down almost 16% for the month.

Small cap and midcap growth stocks outpaced their value counterparts, but large cap growth stocks lagged large cap value stocks.

Volatility returned to the markets, as 11 of 22 trading days generated swings greater than 1% in the S&P 500.


Macro Overview

Macro Overview

Markets oscillated in September, reacting to each positive or negative prospect for a Covid-19 vaccine or additional economic stimulus legislation.  A resurgence of the virus in Europe added to the uncertainty.

Economic data reported in September was mixed.  Manufacturing showed expansion and home sales hit 14-year highs.  Durable goods orders and retail sales also rose, but less than expected.  The unemployment rate declined, but new claims for unemployment averaged about 800,000 per week, about 4x the pre-pandemic rate.  The economy has recovered only about half of the jobs lost in the spring and the rate of job creation appears to be slowing.

The Commerce Department issued its final estimate of second quarter GDP:  down 31.4% annualized, the largest contraction in 73 years.  By one estimate, 73,000 businesses have closed permanently during the pandemic.

Nonetheless, economic activity in the third quarter rebounded from its historically depressed level in the second quarter, largely as the result of extraordinary fiscal stimulus.  But that stimulus has run its course and Fed Chairman Powell urged the government to enact another package.  He said that without more help, “we’ll see sooner or later, probably sooner, that the economy has a hard time sustaining the growth that we’ve seen—that’s the risk.”


Additional Disclosures

Additional Disclosures

Performance data for OPI reflect the reinvestment of dividends and other earnings on the fund’s assets.  Performance data for the major indices reflect only changes in the value of those indices, and would be higher if dividends were included. However, the index data do not reflect fees that would be paid to index fund managers and transaction costs that would be incurred when their component stocks are bought or sold, while OPI’s data do reflect quarterly fees and expenses incurred by the fund.  The information provided is believed to be reliable, but its accuracy or completeness is not warranted. This material is not intended as an offer or solicitation for the purchase or sale of any stock, bond, mutual fund, or any other financial instrument. The views and strategies discussed herein may not be appropriate and/or suitable for all investors. This material is meant solely for informational purposes, and is not intended to suffice as any type of accounting, legal, tax, or estate planning advice. Any and all forecasts mentioned are for illustrative purposes only and should not be interpreted as investment recommendations.