Dow Jones | 33,507 |
S&P 500 | 4,288 |
Nasdaq | 13,219 |
2 Yr Treasury | 5.03% |
10 Yr Treasury | 4.59% |
10 Yr Municipal | 3.44% |
High Yield | 8.84% |
Dow Jones | 1.09% |
S&P 500 | 11.68% |
Nasdaq | 26.30% |
MSCI-EAFE | 4.49% |
MSCI-Europe | 5.39% |
MSCI-Pacific | 2.89% |
MSCI-Emg Mkt | -0.38% |
US Agg Bond | -1.21% |
US Corp Bond | 0.01% |
US Gov’t Bond | -0.86% |
Gold | 1,864 |
Silver | 22.39 |
Oil (WTI) | 90.77 |
Dollar / Euro | 1.05 |
Dollar / Pound | 1.21 |
Yen / Dollar | 149.32 |
Canadian /Dollar | 0.74 |
Macro Overview
A Congressional standoff regarding an increase to the national debt limit led to market volatility in September and early October. Impasses regarding the debt ceiling have occurred numerous times since the limit was established in 1917.
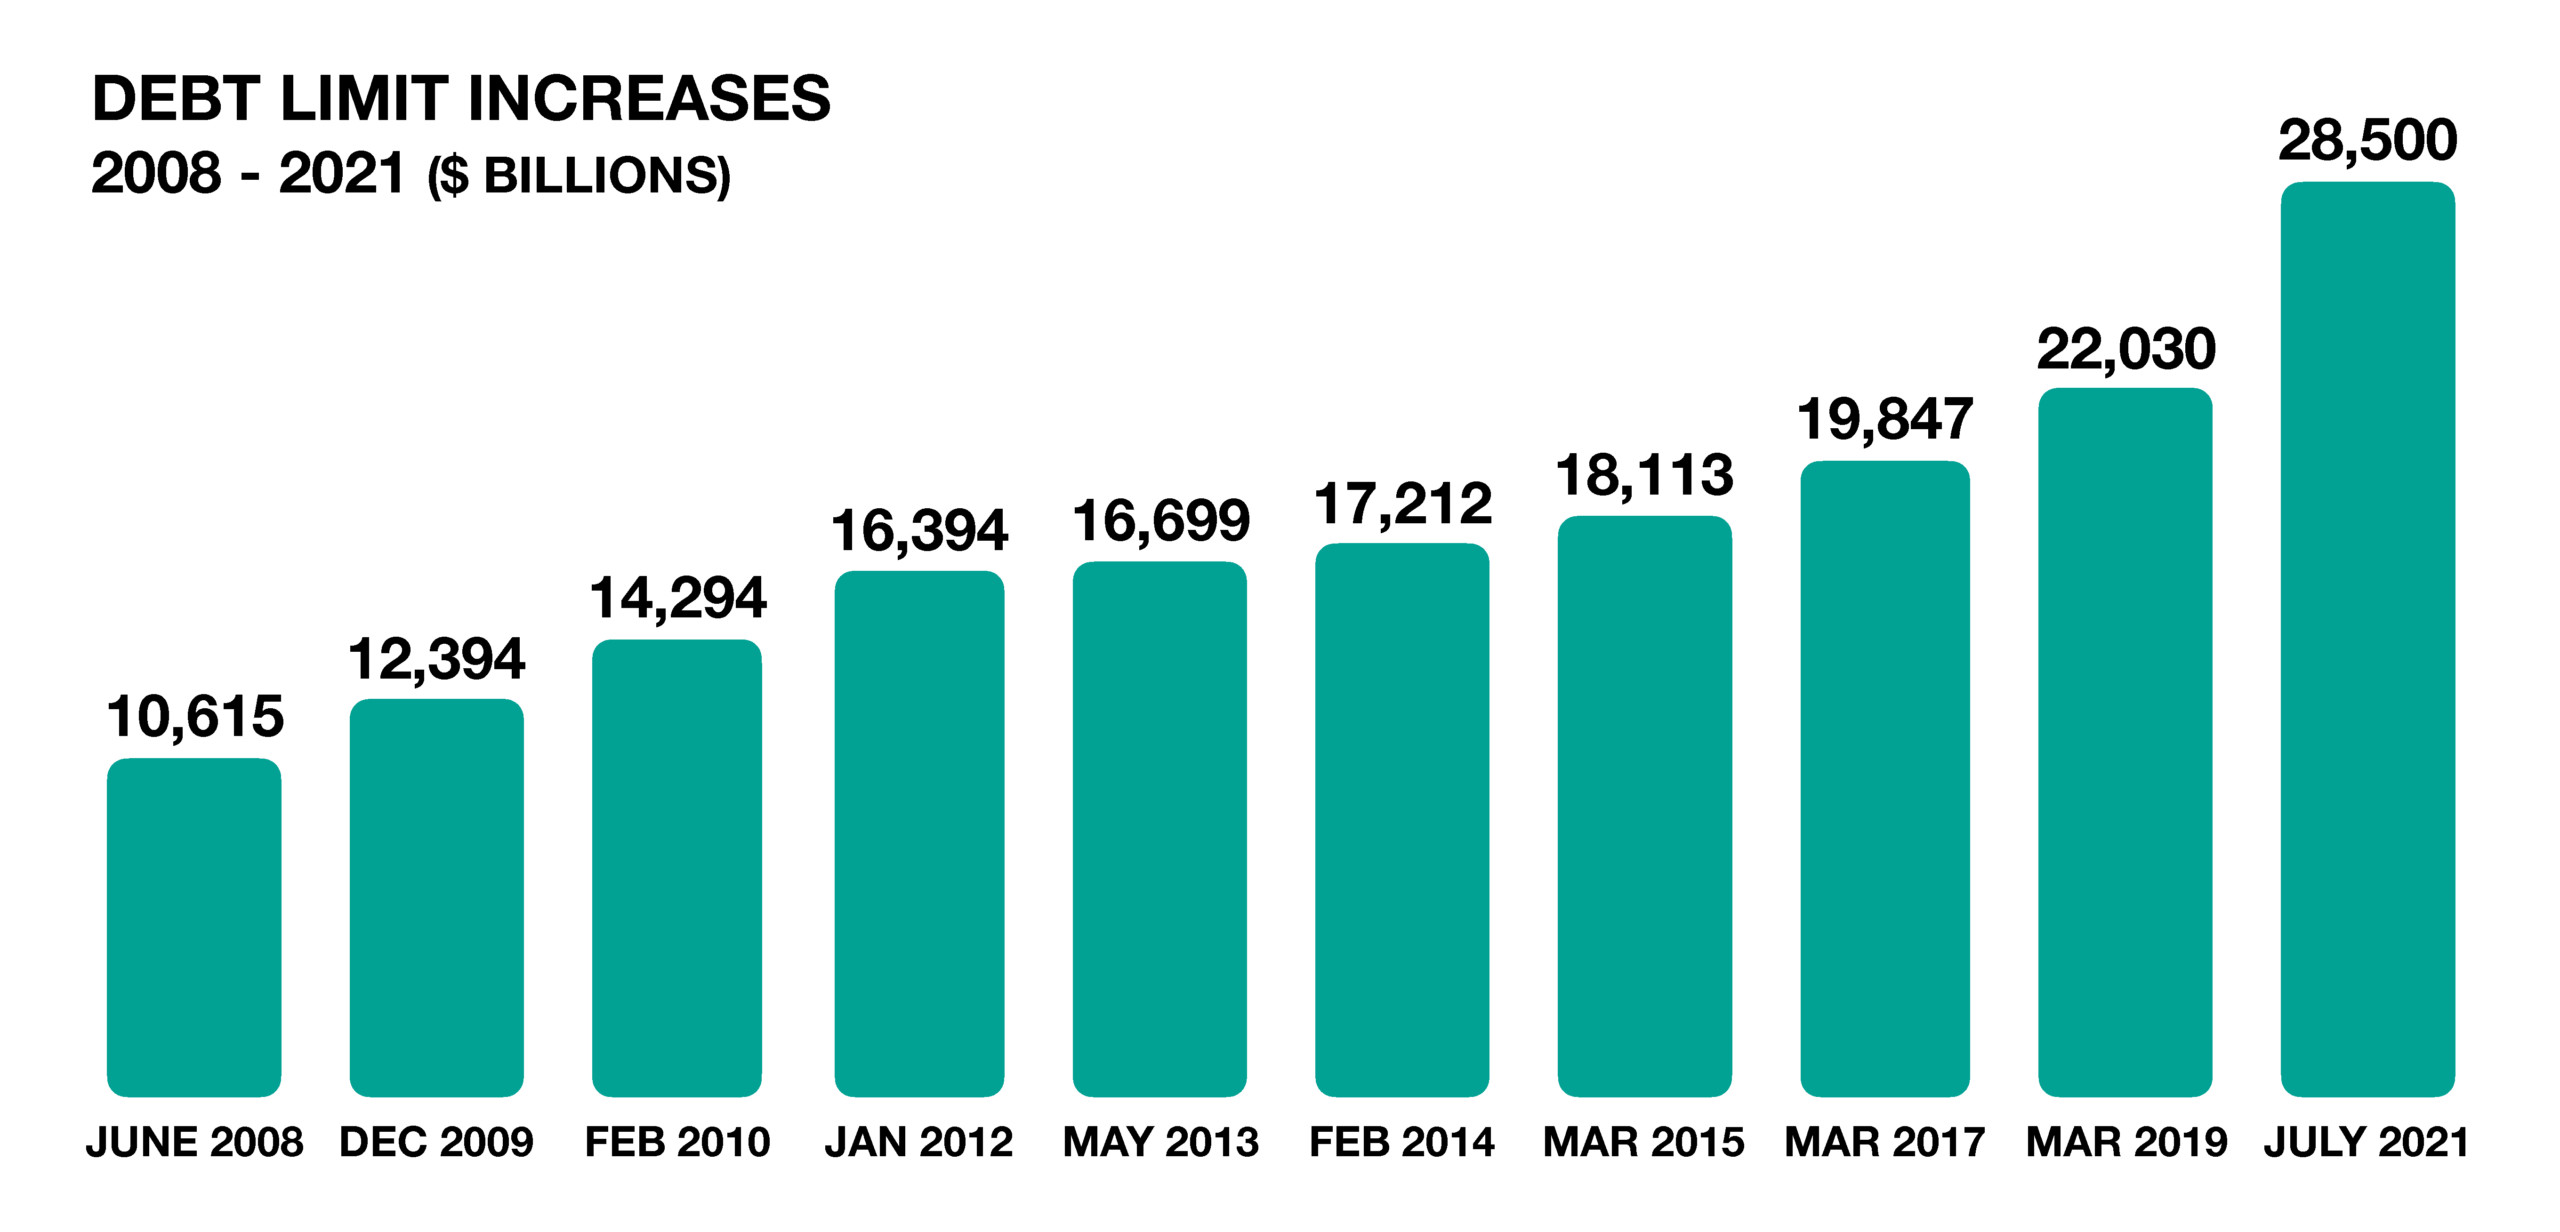
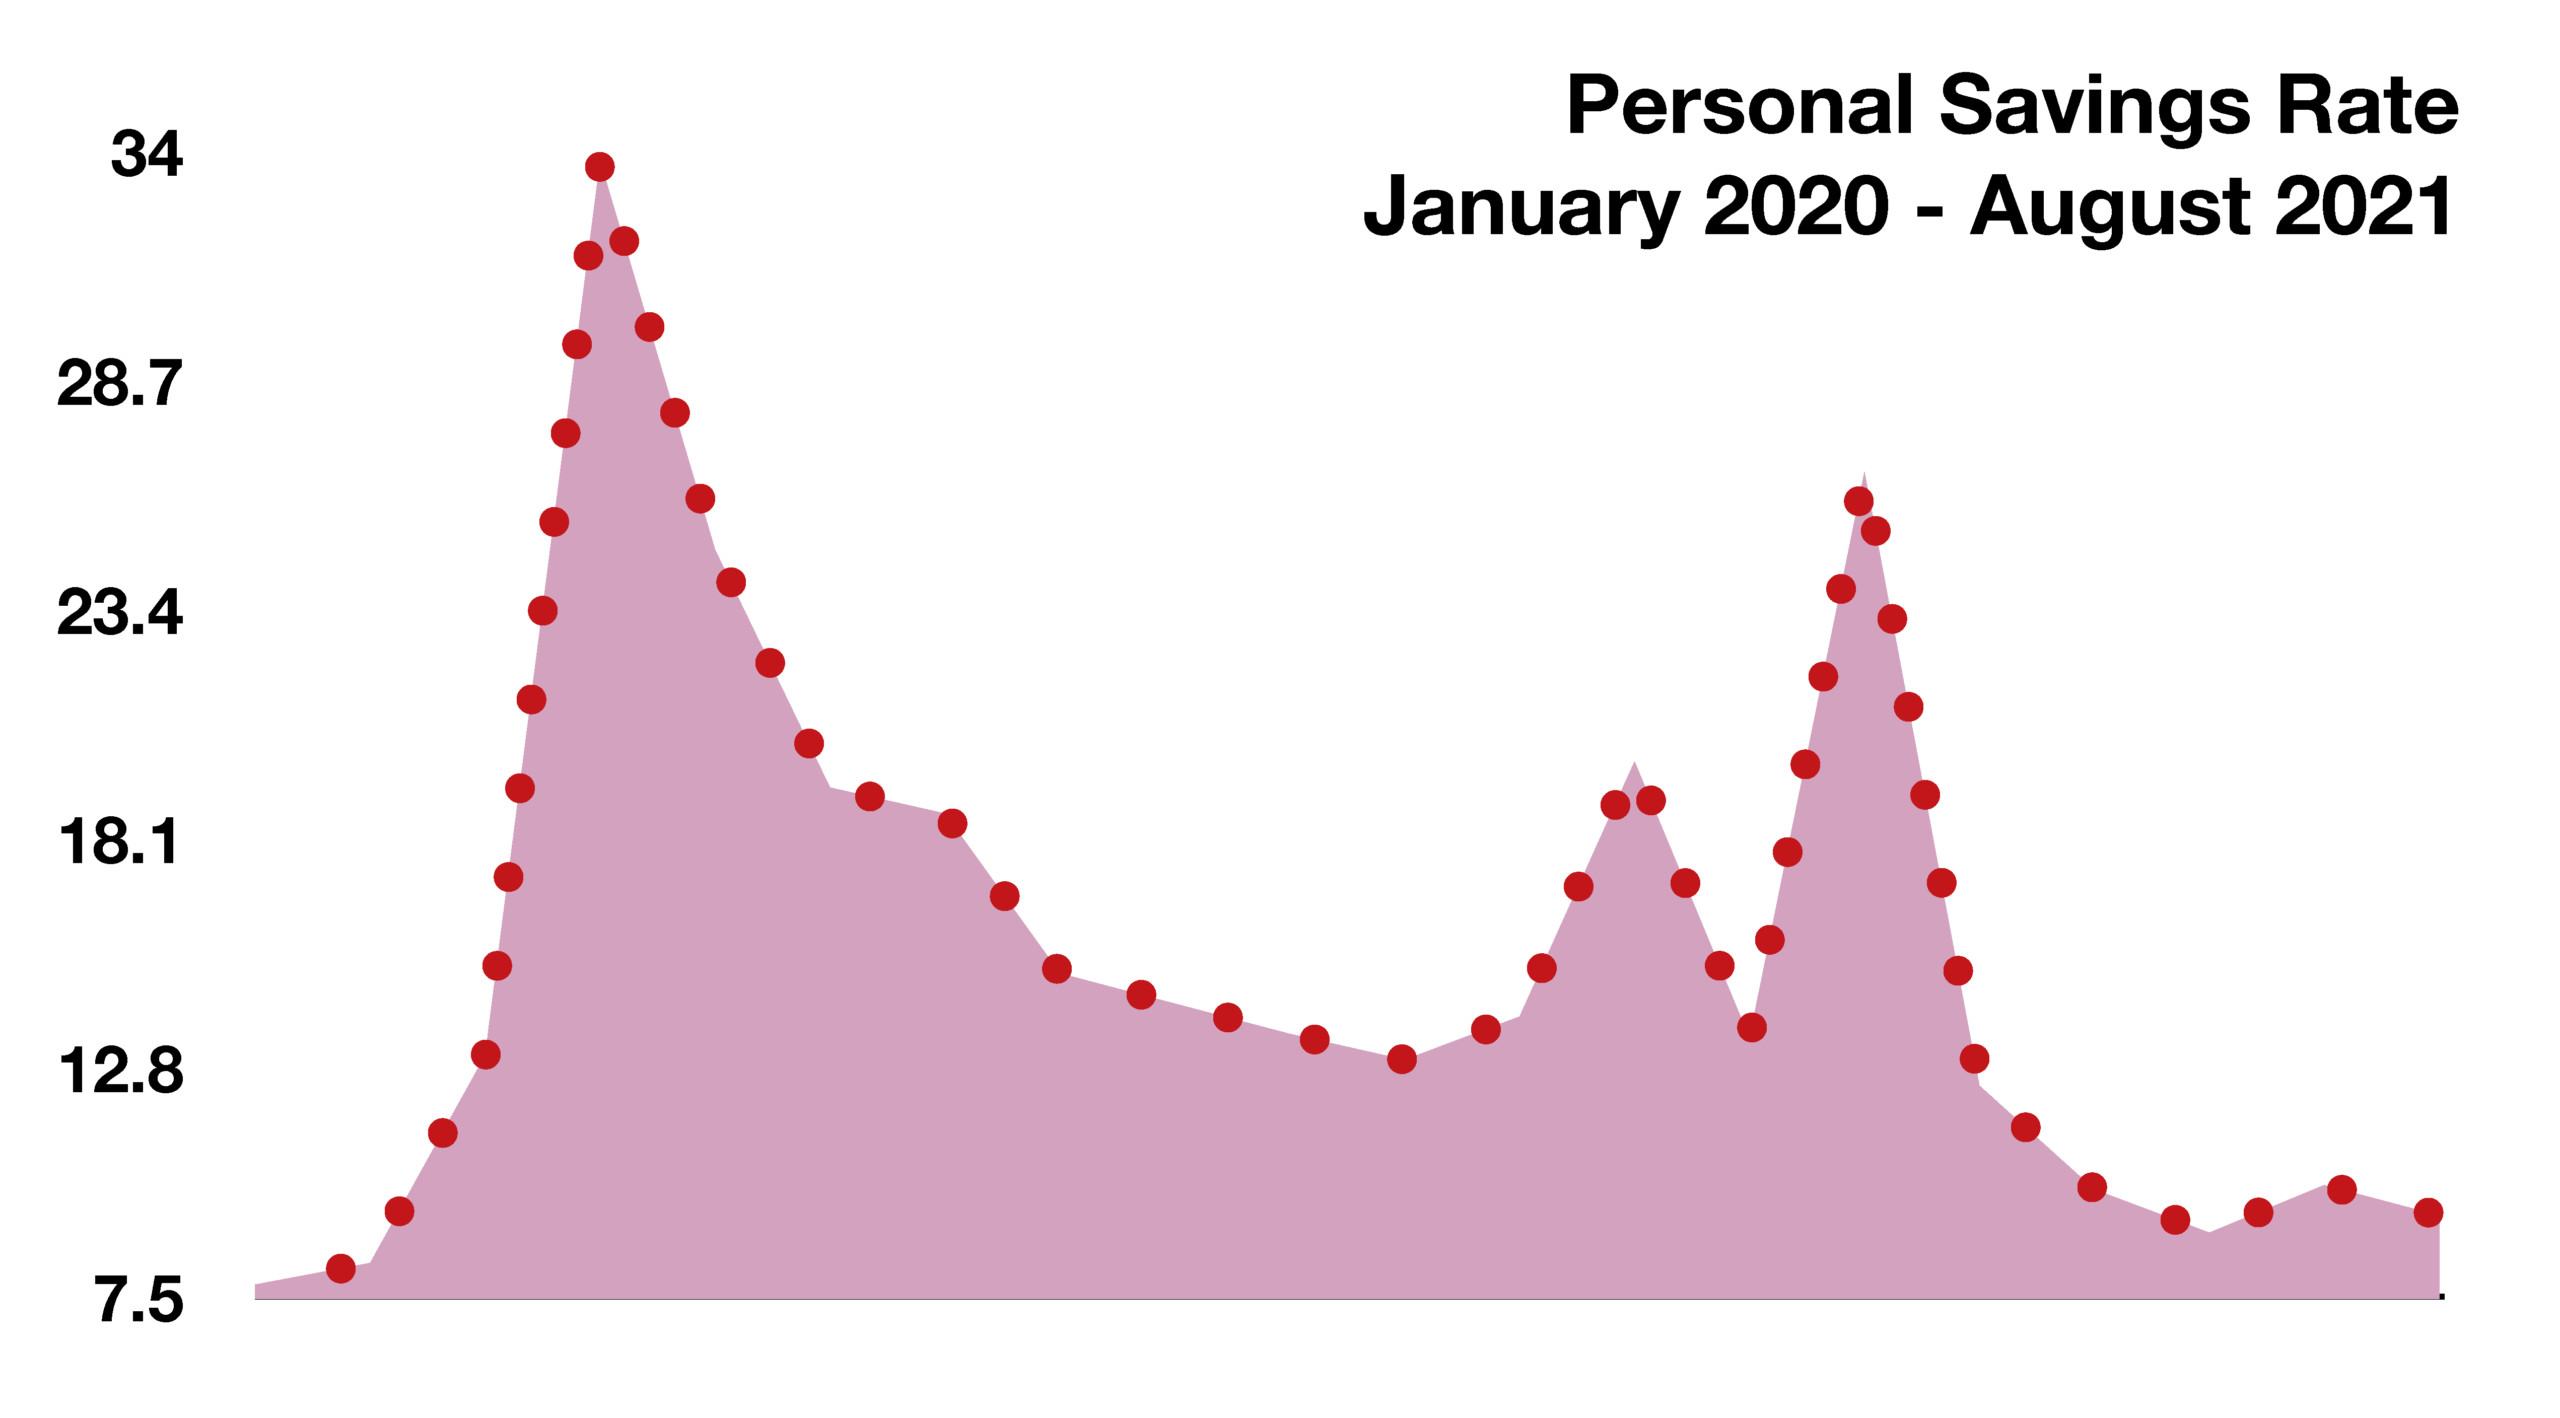
Some economists believe that cessation of stimulus payments and growing inflationary pressures may hinder economic expansion heading into 2022. Adding to consumer tensions are proposed legislative tax reform measures that create uncertainty regarding tax and estate planning. Among the proposals are increased capital gains taxes, reductions in estate tax exemptions, and limits on transferring assets to heirs with favorable tax treatments.
The number of deaths officially attributed to COVID-19 in the U.S. has now surpassed the number of fatalities from the 1918 flu pandemic. The CDC reported that over 675,000 people have died thus far, equaling those who died in the 1918 pandemic. Notably different is the fact that the population of the U.S. has nearly tripled since 1918, meaning that the relative toll in terms of total population is still lower.
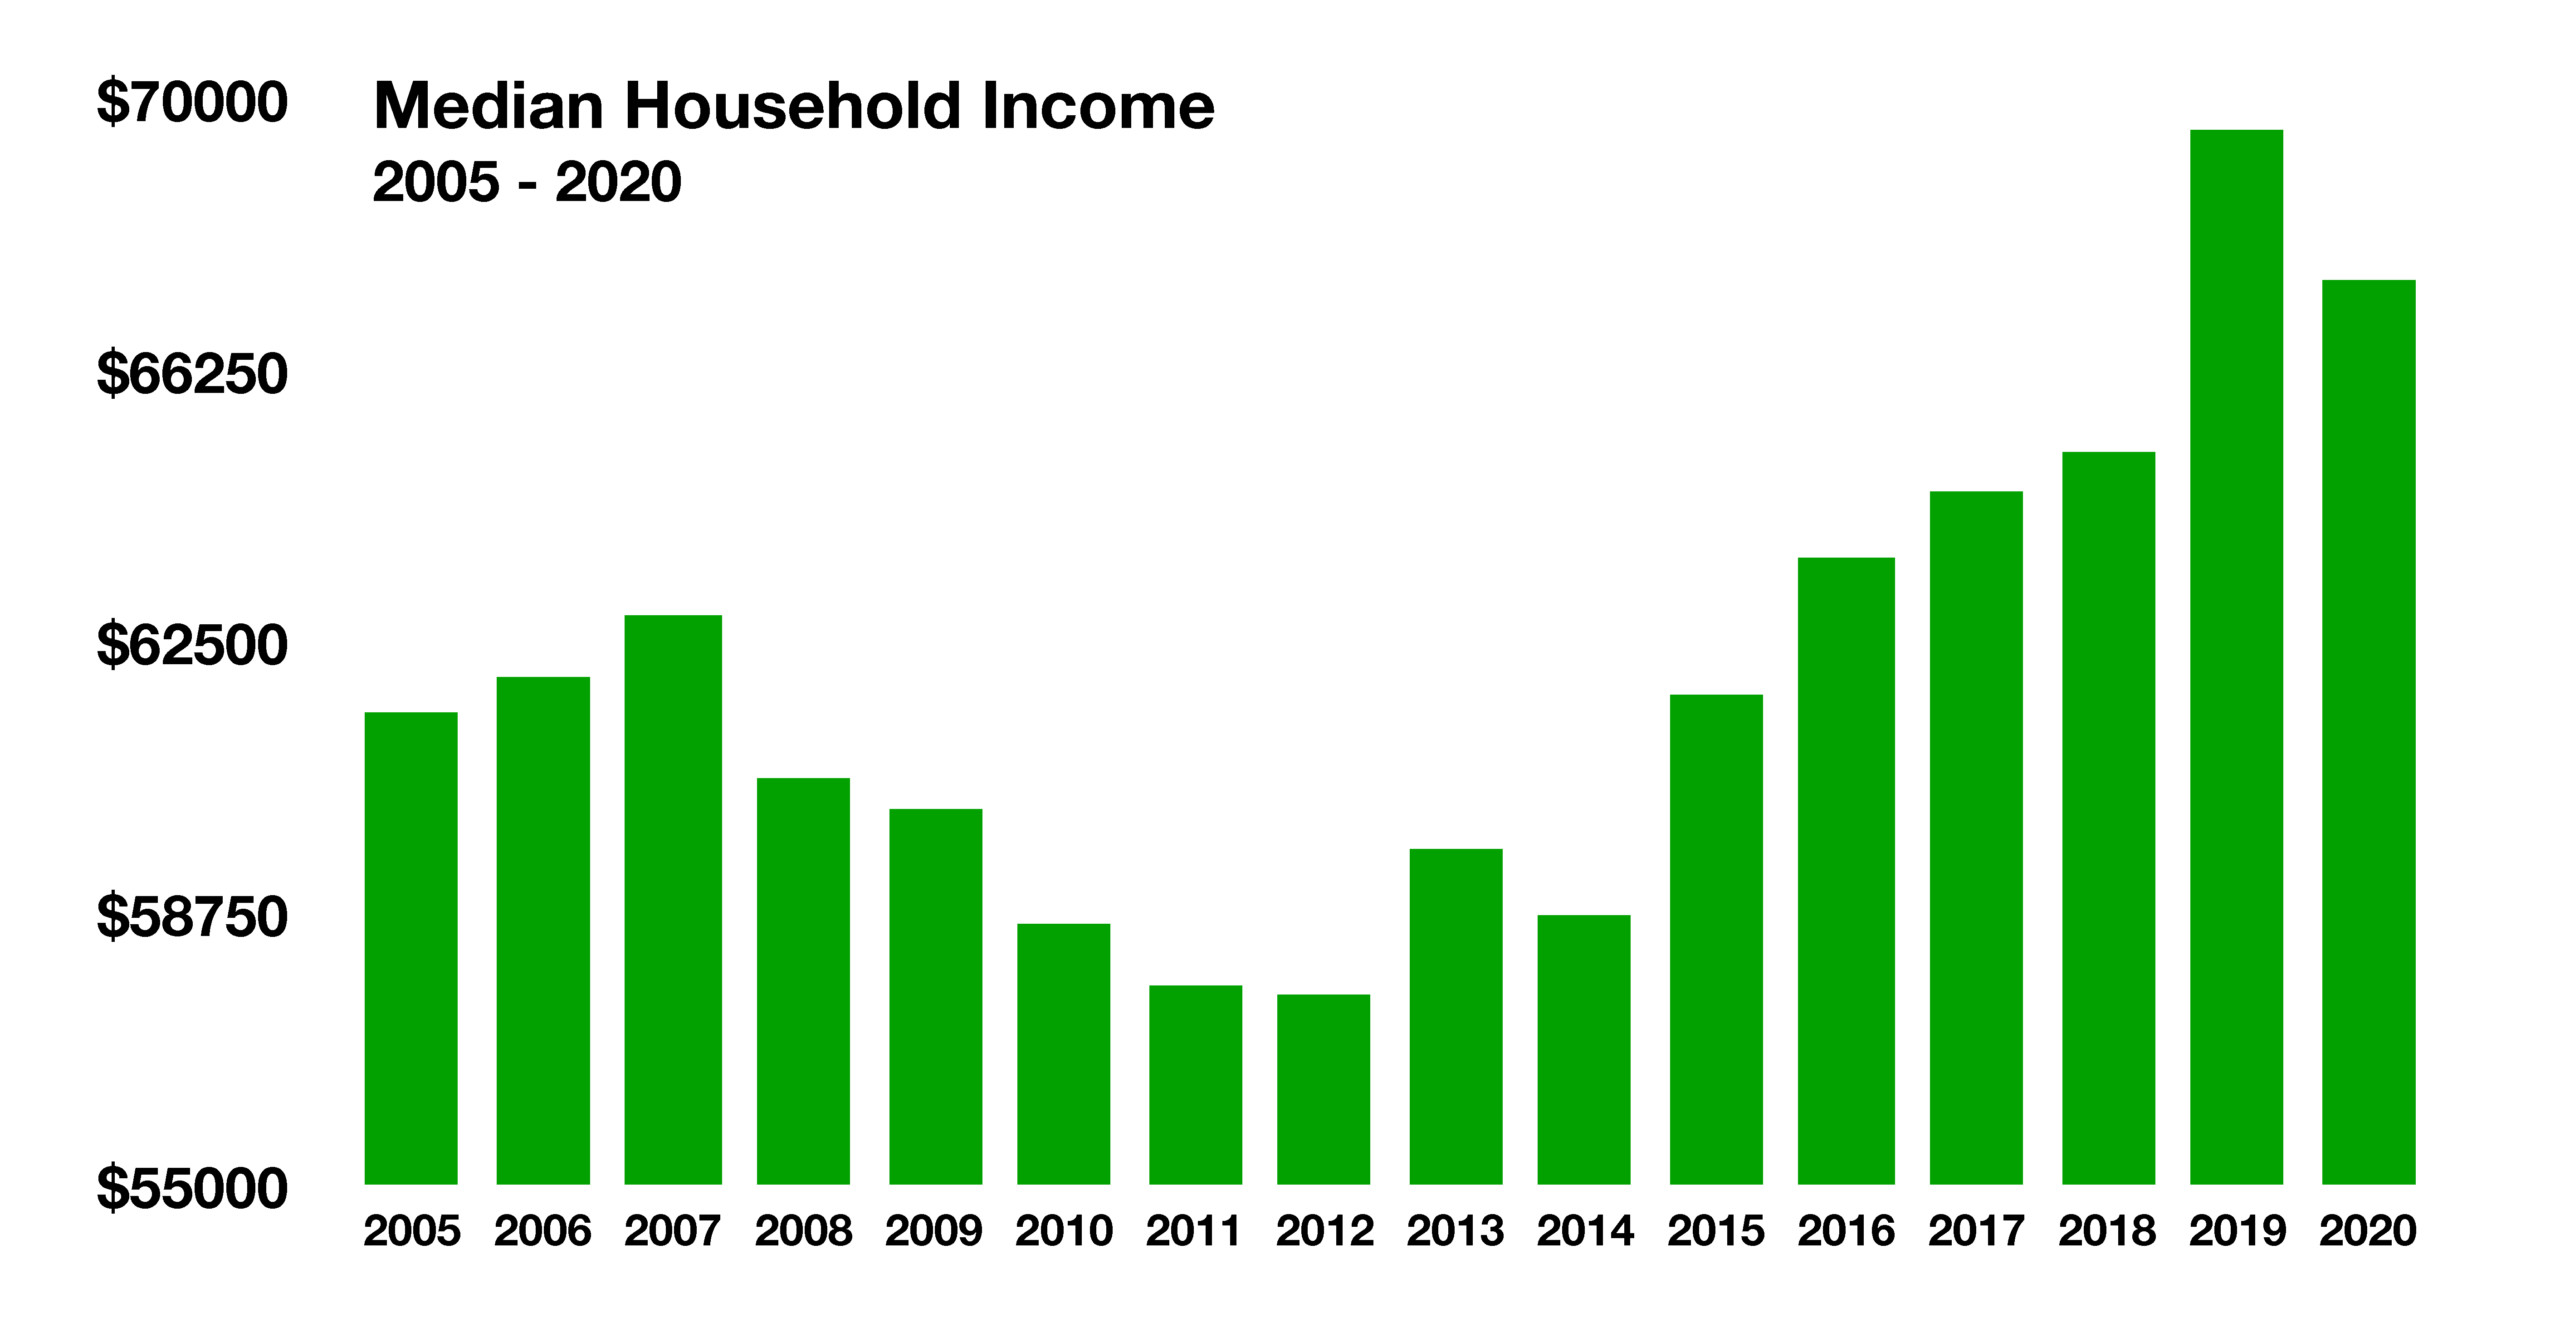
Economists note that wage gains have been trailing price gains throughout the economy, meaning that consumers are able to buy less. Housing rental costs, the largest expenditure for many consumers, are expected to increase as forecast by the Federal Reserve Bank of Dallas. Interest rates rose in September driven by inflationary influences and the Federal Reserve’s signal that it will start to taper stimulus support by the end of the year. Heightened energy prices and ongoing supply constraints are stoking inflationary concerns as consumers resume spending on products and services. Gasoline, oil, and natural gas prices rose in September as supply constraints and increased global demand contributed to price pressures.
The month of September saw two significant opposing positions for digital currency as El Salvador became the first country to adopt a cryptocurrency as its legal tender and China’s Central Bank declared all crypto-related transactions illegal, citing concerns about gambling, fraud and money laundering. (Sources: CDC, U.S. Treasury, Federal Reserve)
Volatility Returns As Uncertainty Prevails – Equity Overview
Volatility returned in September to U.S. and international equities as central bank stimulus efforts are expected to start unwinding by year end. Third-quarter results for major equity indices showed that the financial and utilities sectors led the broad markets, with the energy sector leading all sectors year-to-date.
Equity analysts assess that ongoing supply disruptions have worsened globally as COVID-related issues impact factories and ports worldwide. Freight and energy constraints continue to add costs for companies, posing a material risk to profit expectations.
Sources: Bloomberg, Reuters, Standard & Poor’s
Rates Head Higher – Fixed Income Overview
Rates moved slightly higher in September as markets looked to the Federal Reserve for indications of a taper. Yields on government, corporate and municipal bonds rose, sending bond prices lower.
The Federal Reserve announced that it will likely begin tapering its bond-buying strategy as soon as November, and start raising the target interest rate in 2022. Bond buying by the Fed is a stimulus effort that has contributed to low interest rates.
Freddie Mac reported that the average rate on a 30-year fixed mortgage rose to 3.01% as of September 30th, the highest weekly increase since February.
Sources: U.S. Treasury, Federal Reserve, Freddie Mac
Median Household Income Drops – Demographics
The median household income fell in 2020 for the first time since 2014, according to the most recent Census Bureau data released in September. Widespread stimulus payments and enhanced unemployment benefits were not enough to match prior-year incomes in 2019. As of the end of 2020, the median household income was $67,521, a drop of 3% from 2019. Although the drop doesn’t appear to be significantly consequential, inflation pressures are a concern. Census Bureau data is adjusted for inflation, albeit at only 1.25%, which is directed by the U.S. Bureau of Labor Statistics.
Analysts suspect that the inflation rate may actually be much higher, perhaps approaching the 50-year average of 4.1%. Because of this, some economists express concern that median incomes are not keeping up with inflation and many households may lose purchasing power. (Source: U.S. Bureau of Labor)
The Debt Ceiling – Fiscal Policy
Formally known as the statutory debt limit, the United States debt ceiling is a legislative restriction on the amount of national debt that can be issued by the Treasury. The debt limit has been raised 79 times since its creation last century, with 17 of these increases occurring over the past 20 years.
The United States has maintained legislative restriction on debt since 1917. In order to control the amount of total debt outstanding, Congress placed restrictions on Federal debt issuance with the Second Liberty Bond Act of 1917, which eventually evolved into a general debt limit in 1939. The Second Liberty Bond Act of 1917 helped finance the United States’ entry into World War I, allowing the Treasury to issue long-term Liberty Bonds.
Periodically, a political dispute arises over legislation to raise the debt ceiling. Until the debt ceiling is raised, the Treasury undertakes what is termed as “extraordinary measures”, which essentially buys more time for the ceiling to be raised.
The United States has never reached the point of default, at which the Treasury is unable to pay its obligations. In 2011 the United States reached a point of near default, which in turn triggered the first downgrade of U.S. debt by credit rating agencies. Congress raised the debt limit with the Budget Control Act of 2011, which led to a new debt ceiling that was reached on December 31, 2012. (Source: Congressional Research Service, U.S. Treasury)
Hybrid Auto Sales Grow – Auto Industry Overview
The adoption of hybrid and electric cars worldwide has been a trend for years, with relatively limited options from manufacturers. A recent surge of new entrants into the market, along with rapidly advancing electric motor and battery technology, has provided a flurry of additional options for consumers.
Government subsidies and environmental sensitivity have also helped increase the popularity of hybrid vehicles, thus propelling sales upward. Currently, there is a $7,500 federal tax credit for the purchase of a new electric vehicle. Some Congressional leaders are proposing even larger tax credits and an extension of those credits through 2031.
There are currently over 253 million cars and trucks on U.S. highways, and roughly 550,000 of them are electric. Electric vehicles have grown in popularity in other countries as new models and manufacturers evolved. China, Japan, the Netherlands, and Norway are among the countries with the largest quantity of electric vehicles. Hybrid auto sales outpaced electric auto sales as numerous manufacturers and brands introduced new models, prompting competition in the industry. Hybrid auto sales grew to over 454,000 vehicles in 2020, an upward trend from only 9,350 vehicles in 2000, as tracked by the Department of Transportation. (Sources: InsideEVs, Dept. of Transportation)
Americans Tapping Savings – Consumer Behavior
As store and restaurant closures prompted people nationwide to stay home last year, consumers spent less and saved more. In addition, massive stimulus efforts by the government placed funds in millions of consumer savings accounts last year, shoring up the national savings rate.
The most recent savings rate data reveals that consumers are now saving less, perhaps tapping their savings accounts as prices have increased and stimulus payments have subsided. The personal savings rate as of October 1, 2021 stood at 9.4%, down from 33.8% in April 2020.
Dwindling consumer confidence, combined with uncertainty about the job market, shifted many from a spending mindset to saving mode in 2020. The average savings rate for the past 60 years has been 8.9%. The savings rate jumped from 8.4% in February 2020 to 33.8% in April 2020 as the pandemic took hold of the U.S. economy.
Economists view the decrease in savings part of a sustained economic expansion. Since nearly 70% of Gross Domestic Production (GDP) is represented by consumer expenditures, higher savings tend to take away from spending throughout the economy. Consumer confidence is also a factor as a lack of confidence tends to increase savings while minimizing spending. (Source: https://fred.stlouisfed.org/series/A072RC1Q156SBEA)
How To Check On Your Social Security Benefits Before Retiring – Retirement Planning
As retirement approaches, estimating income for the retirement years is critical in planning for living and leisure expenses. Experts suggest requesting an updated Social Security Statement, which estimates projected benefit payments at different ages. As many individuals have been working longer than previously expected before retiring, the additional income can increase Social Security benefits.
The earliest age at which one can take Social Security is 62, which pays a lower benefit than waiting until the full retirement age of 66 for those born between 1943 and 1954. Full retirement age increases gradually for those born between 1955 and 1960 until reaching age 67. For anyone born 1960 or thereafter, full retirement age is 67.
In order to request your estimated benefit payments, the Social Security website provides friendly calculations and estimates based on your most current tax year filing. Simply visit https://www.ssa.gov/myaccount/retire-calc.html (Source: www.ssa.gov)