 Calton & Associates Inc.
Scott Coffee
Registered Representative
10205 Westheimer, Suite 500
Houston Tx, 77042
832.866.9476
Stock Indices:
| Dow Jones | 39,807 |
| S&P 500 | 5,254 |
| Nasdaq | 16,379 |
Bond Sector Yields:
| 2 Yr Treasury | 4.59% |
| 10 Yr Treasury | 4.20% |
| 10 Yr Municipal | 2.52% |
| High Yield | 7.44% |
Commodity Prices:
| Gold | 2,254 |
| Silver | 25.10 |
| Oil (WTI) | 83.12 |
Currencies:
| Dollar / Euro | 1.08 |
| Dollar / Pound | 1.26 |
| Yen / Dollar | 151.35 |
| Canadian /Dollar | 0.73 |
Bonds
- A common type of loan investment is bonds
- A bond is basically an IOU sold by the government or a company in order to raise money
- In return for the loan, the bond investor is promised a return of principal and periodic interest payments
- Bonds are often purchased by investors to generate income
These terms apply to the holder of an individual bond, NOT the holder of a bond Mutual Fund. Most 401(k) accounts only allow you to buy bond Mutual Funds, not individual Bonds.
Bonds vs. Bond Funds
- Investing in a bond is not the same as investing in a bond mutual fund
- Bond funds do not pay fixed interest or pledge to return your investment
Bonds are inversely related to interest rates. When interest rates go up the value of existing bonds go down. The reason for this is that the bonds issued at the new higher interest rates are more valuable due to their higher coupon. This inverse relationship between bond prices and interest rates will cause bond mutual funds to go down in value what rates are going up, as they currently are.

In a bond Mutual Fund, the price of your shares will fluctuate with interest rates, and income you get is the average coupon of the bonds in the fund minus all of the funds expenses. There is no fixed maturity, and when interest rates move up, as they have been doing this year, there is a high probability that the value of your shares will go down in value. If you are holding an individual bond, you know up front what you will receive at maturity. Individual bonds provide permanence and certainty, a bond mutual fund provides neither.
Bond Basics
- Face value – Sometimes referred to as par, face value is the amount for which a bond is initially sold and will return in principal if held till maturity
- Coupon rate – The stated rate of interest on an issued bond
- Yield – The annual percentage rate of return on your investment
- Maturity date – The date in which the government or company has agreed to repay your investment principal
- The term – The time period between the initial issue of the bond and the maturity date
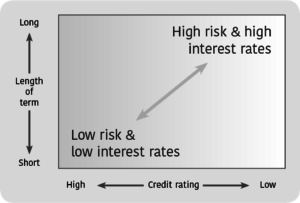
Bond Rates
The interest or coupon rate of a bond is usually determined by:
- Length of term
- Credit of issuer: lower credit rat
The advantage: If you buy a bond on the day it is issued, you can expect a fixed income over a certain time period as well as the return of your principal at the end of the term.
The disadvantage: The corporation or government issuing the bond may not be able to paings involve higher risk and usually offer higher interest

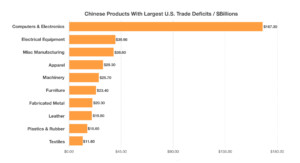 Electronic devices and computers are the products with the largest trade deficits with the U.S. Over the past few years, American consumers have become accustomed to inexpensive Chinese made products available in every retail and online store across the country.