Stencil Wealth Management Inc.

7230 Connecticut Avenue Suite 100

Fairhood, NY 91942

www.stencilwm.com

877.775.7745

August 2016

Macro Overview

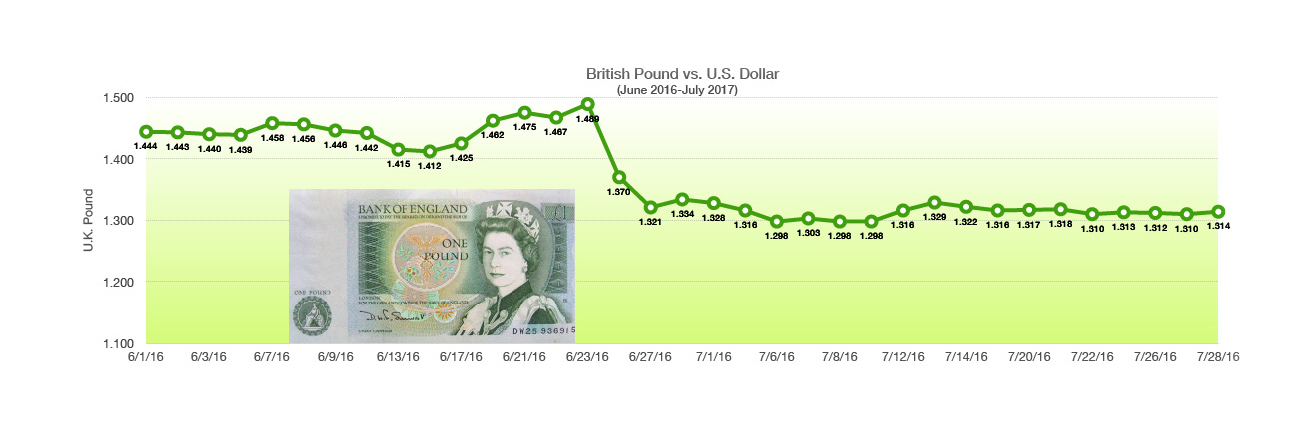
Macro risks are still prevalent throughout the world as the effects of Brexit and terrorism continue to be ongoing concerns. U.S. markets have been resilient to the uncertainties, as major U.S. stock indices reached new highs in July.

Some believe that the outcome of the EU vote, as well as the sentiment in Britain shortly before the vote to leave the EU, has many similarities to the U.S. presidential race. Key election issues and how they may affect the economy include: NAFTA, immigration, terrorism, and banking regulations such as Glass-Steagall and Dodd-Frank.

The presidential campaign has brought about the suggestion of reforming existing regulations affecting the banking and financial services industry. Some candidates argue for the repeal of Dodd-Frank, regulations put in place during the current administration to regulate banking activity. The problem has been that the costs of the new regulations have inhibited smaller banks and credit unions. Some candidates lobbied to bring back legislation known as Glass-Steagall, put in place during the depression in order to prevent banks from combining financial services, investment banking, and loans simultaneously.

Presidential Election Voting Poster Set. Vector Illustration.

Economic growth, measured as GDP, was reported by the U.S. Department of Commerce to have increased at an annual rate of 1.2 % in the second quarter of 2016, below analysts expectations of 2.5%. The dismal GDP report was accompanied by a drop in oil prices of over 15% in July and a record low for the 10-year Treasury yield hitting 1.37%.

Upcoming economic data for the U.S. may influence the Federal Reserve to act on raising rates rather than waiting any longer. Analysts believe that a rate increase by the Fed before the end of 2016 based on U.S. economic data may be a mistake. Rates in Europe and Japan remain in negative territory due to the uncertainty of growth within the EU and the expected derogatory effects of Brexit on global business transactions. Fed members decided to leave interest rates unchanged during their July meeting, stating that it was prudent to wait for more data following the consequences of Britain leaving the EU.

Banks in Italy have become the latest of concerns in Europe as souring loans are being recognized throughout the Italian banking sector. As the third largest economy in the EU, Italy’s banking sector is prone to a crisis that could have dire consequences for the country and neighboring trading partners.

Sources: EuroStat, Dept. of Commerce, Federal Reserve, ECB


Stencil Wealth Management Inc.

7230 Connecticut Avenue Suite 100

Fairhood, NY 91942

www.stencilwm.com

877.775.7745

REITs Will Earn Their Own Category Within The S&P 500 Index This Month

Effects of Brexit On The British Pound – Currency Update

The pound has plunged 14% against the U.S. dollar since the UK voted to leave the European Union on June 23. Since the start of the year, the pound is down about 12% and trading at its lowest levels since 1985.

The possibility of the UK experiencing negative consequences with EU relationships, as well as a lingering recession being triggered by an exit from the EU, has dampened consumer confidence throughout Britain and held back any further expansion plans for companies. Conversely, the depressed pound has made Britain a tourist destination for travelers whose currencies have risen versus the pound, such as for Americans and Canadians.
British Pound vs Dollar July 2016
The rating agencies have all made revisions to Britain’s debt since the EU vote, including downgrades, making it more expensive for the country to borrow money.

Standard & Poor’s lowered its rating and warned that Brexit will weaken the predictability, stability and effectiveness of British policymaking and deter foreign investment in the UK. S&P said that the country’s banking system, which is a vital component of the economy, is very susceptible to EU fallout leading to more possible downgrades.

Fitch Ratings, another ratings firm, also issued a downgrade for the UK at AA, down by one notch from AA+ previously, and warned more cuts could come. The UK now has a more unfavorable rating from S&P than the U.S. S&P famously lowered the U.S. rating by one notch to AA+ in 2011, setting off financial and political disarray. The UK has the highest financing needs among all 131 countries that Fitch rates, at nearly twice the level of the U.S. and France. (Sources: S&P, Fitch, Moody’s, Reuters)


Stencil Wealth Management Inc.

7230 Connecticut Avenue Suite 100

Fairhood, NY 91942

www.stencilwm.com

877.775.7745

A Gold Olympic Medal Is Worth About $564

What An Olympic Gold Medal Is Actually Worth – Market Fact

Of the 78 countries that won medals in Rio, the U.S. won more Olympic medals than any other country that participated with a total of 121 medals. Of those, 46 were gold, 37 silver, and 38 bronze.Olympic-Medals

Surprisingly enough, U.S. Olympic athletes receive no formal financial support from the U.S. government. Instead, financial assistance is provided by the U.S. Olympic Committee, which is a federally chartered nonprofit entity receiving no federal funding whatsoever. Conversely, almost every other country that participated in the Rio Olympics offered government sponsored financial support. Countries such as Canada, China and the U.K. have appointed sports ministers that have dedicated resources available for Olympic athletes. Uniquely, Team USA athletes rely on the generosity of the American people to achieve their Olympic dreams. In addition to receiving a medal, the U.S. Olympic Committee also awards a cash prize along with each metal. Athletes are awarded $25,000 for gold metals, $15,000 for silver, and $10,000 for bronze. What’s interesting is that the cash prizes are worth much more than the medals themselves. Based on recent commodity prices, the value of a gold medal is about $564, silver is roughly $305, and bronze is barely worth anything. (Sources: U.S. Olympic Committee)

Credit Card Debt On The Rise – Consumer Finance

U.S. banks have ramped up lending to consumers through credit cards at the fastest pace since 2007. The industry has accumulated an additional $18 billion of credit card loans and other types of revolving credit in the past three months.

Data released by the Federal Reserve shows that the U.S. banking industry has seen credit card and other revolving loans rise at a annual rate of 7.6% in the second quarter of 2016, to $685 billion. The credit card business remains among the most profitable in banking as banks can charge much higher interest rates than other loan types, with average credit card rates between 12% and 14%.

Yet as credit card debt levels have risen, so have reserves for losses as banks anticipate delinquencies to rise. Within the past year U.S. banks have piled on about $54 billion worth of loans to consumers through credit cards, according to Federal Reserve data. Financially savvy consumers that pay their balances down each month avoid hefty interest charges, but those that don’t, known as “revolvers,” pay average rates of between 12% to 14% and significantly more if they are considered higher risk. Seven years since the recession ended, consumers who were hit hard during the financiTotal Credit Card Debt
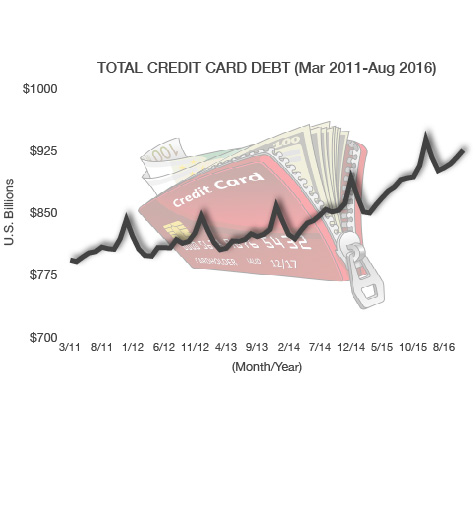
al crisis have found their credit scores improving. Bankers attribute a rise in credit card issuance to rising home prices and low unemployment. Banks are also lending more since one of the most important drivers of their profits are net interest margins, the difference between returns on assets and the cost of funds, which remain near their lowest levels in decades. The average credit limit per card for a subprime borrower is about $2,300, compared with about $11,500 for the safest customers.

Source: Federal Reserve


Stencil Wealth Management Inc.

7230 Connecticut Avenue Suite 100

Fairhood, NY 91942

www.stencilwm.com

877.775.7745

As We Get Older Our Spending Patterns Change

How Age Determines What We Spend On – Consumer Demographics

Demographics play a significant role in how much we spend and how we spend it. Spending is primarily dictated by age where different needs and life essentials change and evolve as consumers grow older.

What We Spend Our $ On
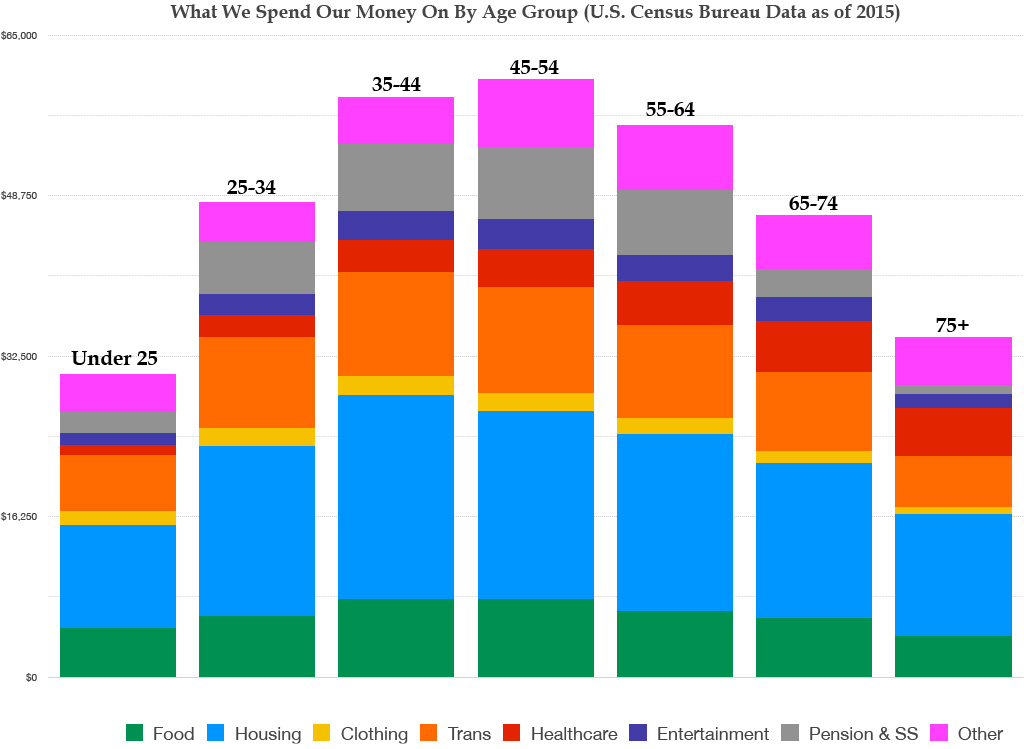
Housing, transportation and food are the three largest expenses incurred by all age groups. As consumers move from their late 20s into their 30s, we earn more money and families start to grow. Expenditures on transportation, health care and entertainment become prevalent as households grow with children.

As we earn more, we also tend to save more in our 30s, 40s, and 50s by contributing to 401k plans and retirement savings. At 75 years of age and older, our retirement savings start to reduce as withdrawals increase to replace lost earned income.

Sources: Social Security Administration, U.S. Census Bureau

Bank Failures & The FDIC – Historical Note

The FDIC evolved following the aftermath of the market crash of 1929, when more than 9,000 banks failed between October 1929 and March 1933. The FDIC was formed when the Banking Act of 1933 was signed by President Roosevelt to protect bank depositors against bank insolvencies.

Bank failures are a direct result of lagging economic circumstances and a contraction on bank held assets. This is why bank failures skyrocketed during the first few years of the depression, then tapered off once stability was reestablished. Bank failures weren’t an issue for decades until the S&L crisis in the early 90s and the results of the financial crisis of 2008. Since 2000, there have been 546 bank failures, the bulk occurring the three years following the crisis of 2008. For the pBank Failures
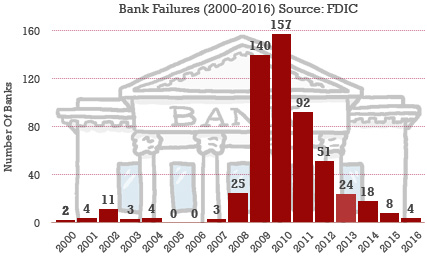
ast two years, failures among banks have been minimal.

Deposit insurance coverage was initially set at $2,500 in 1934, which has risen to $250,000 today. The current FDIC limit is substantially more than it was in 1934, even on an inflation-adjusted basis. The $2,500 FDIC limit in 1934 is equal to $44,896.83 in today’s dollars.

Source: FDIC