September 2017
Market Update
(all values as of 04.30.2024)

Stock Indices:

Dow Jones 37,815
S&P 500 5,035
Nasdaq 15,657

Bond Sector Yields:

2 Yr Treasury 5.04%
10 Yr Treasury 4.69%
10 Yr Municipal 2.80%
High Yield 7.99%

YTD Market Returns:

Dow Jones 0.34%
S&P 500 5.57%
Nasdaq 4.31%
MSCI-EAFE 1.98%
MSCI-Europe 2.05%
MSCI-Pacific 1.82%
MSCI-Emg Mkt 2.17%
 
US Agg Bond 0.50%
US Corp Bond 0.56%
US Gov’t Bond 0.48%

Commodity Prices:

Gold 2,297
Silver 26.58
Oil (WTI) 81.13

Currencies:

Dollar / Euro 1.07
Dollar / Pound 1.25
Yen / Dollar 156.66
Canadian /Dollar 0.79
 

Macro Overview

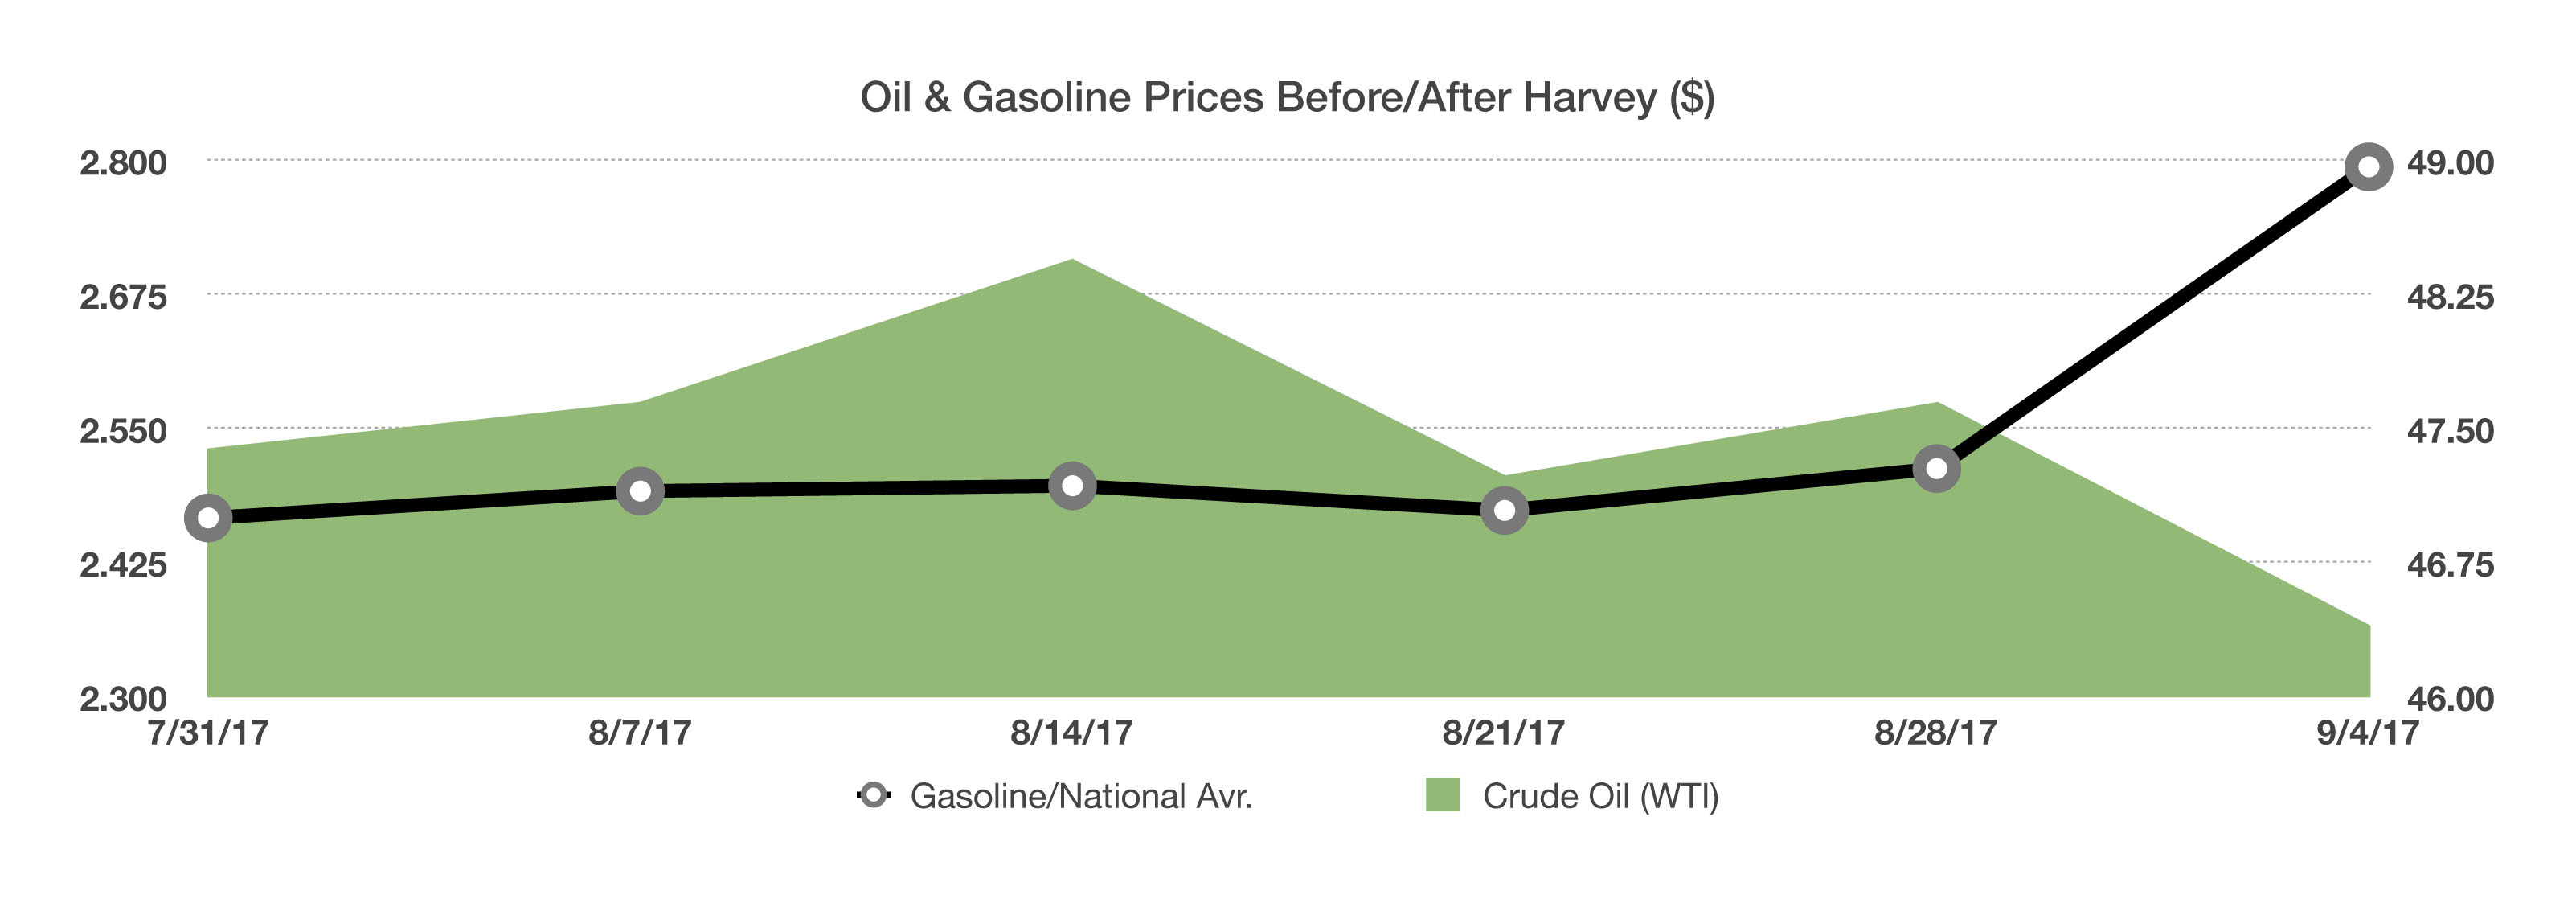
While Hurricane Irma continues to churn in the southeastern United States with the actual financial impact still unknown, Hurricane Harvey is on track to be one of the most costly natural disasters in U.S. history. President Trump and congressional leaders have recently struck an agreement to increase the politically charged debt ceiling in order to help fund repair efforts in Texas. The agreement will avert a government shutdown until mid-December, providing essential funds for ongoing government operations. In anticipation of the vast repair efforts, Harvey’s destruction alone could be a catalyst for economic expansion as the cleanup and rebuilding process begins. Such an effort, as occurred in Louisiana following Katrina, will involve concrete, lumber, plumbing, and electrical components from all over the United States.

The hurricane affected and closed an estimated quarter of all U.S. refining capacity. Harvey’s impact on the price of refined crude oil products, such as gasoline and jet fuel, validates how crucial the Gulf Coast and Texas are to the global energy markets. Ever since Congress lifted the oil export ban in December 2015, almost all exports of U.S. oil are shipped from ports in Texas. Department of Energy data shows that U.S. refiners were using 96.6% of their available capacity before Hurricane Harvey hit, the highest rate since 2005.

Unemployment has fluctuated between 4.3% and 4.4% over the past three months, with the most recent data lifting the unemployment rate to 4.4%. Even with such a low unemployment rate, the growing concern among economists and analysts is that wage growth is essentially stagnant, with less than 0.1% growth in August as reported by the Labor Department. Year-over-year growth for hourly earnings has been stuck at 2.5%, which means that American workers are barely keeping ahead of the current annualized inflation rate of 2.0%.

There are several suggestions as to why wage growth has remained stagnate. Ever since the crisis of 2008/2009, companies have embraced profound cost reductions, while also grappling with demographical constraints. Downward pressure on wages has also been a result of older (baby boom) workers retiring and being replaced by younger, lower paid workers.

For the prior year, the rising costs of health care and housing accounted for roughly 40% of growth in consumer spending. The two prominent age groups affected are seniors subject to rising healthcare costs, and younger consumers that struggle to purchase a home.

 It is expected that the Federal Reserve will finally decide to start paring its $4.4 trillion balance sheet of mortgage and government bonds this fall, following its two-day September policy meeting. No one truly knows how that will unravel, since it has never actually occurred to this magnitude.

Equity markets continued their resilient climb in August, with the Dow Jones Industrial Index reaching 22,000 for the first time. Geopolitical risks with North Korea helped drive government bond yields lower, as risk adverse tactics evolved. (Sources: Department of Labor, Department of Energy, Dow Jones, NOAA)


The Dow Jones Average Index Reached 22,000 For The First Time

Yields Hold Steady – Fixed Income Update

Heightened geopolitical tensions drove the demand for government bonds as investors allocated to safe havens driving bond prices higher and rates lower.

Several large U.S. corporations raised capital in the debt markets in August, taking advantage of the low rate environment. Apple and Tesla both borrowed through the debt markets at ultra low interest rates.

The national municipal bond market is bracing for the effects of Hurricane Harvey and Hurricane Irma, as municipalities assess the fragility of their tax base during the aftermath of the storms.

Bonds across most fixed income segments advanced modestly following tepid remarks by the Fed regarding economic data and inflation numbers. (Sources: Fed, Reuters, Bloomberg)

Equities Remain Immune To Geopolitical Events – Global Equity Markets

Equity markets were resilient in August to geopolitical events as major indices rose to higher levels. The Dow Jones Industrial Index reached 22,000 for the first time.

Emerging markets continued to experience the benefit of a weakening U.S. dollar, with a rise in August. For emerging markets, a weaker dollar makes it easier for those holding debt denominated in U.S. dollars to repay them. This is a significant factor since emerging markets carry a large amount of debt. A weaker dollar also helps exporters of commodities, as a weak dollar tends to boost commodity prices.

Companies are already struggling with tight margins so any increase in expenses would further reduce margins unless higher costs are passed onto consumers in the form of higher prices. (Sources: Bloomberg, Reuters, Dow Jones)

More Homes For Sale, Fewer Homes Sold – Housing Market Update

Dynamics within the housing market are a result of wages, consumer sentiment, interest rates, and the economic environment. Over the past year, the number of homes for sale and the number of homes sold has diverged. The U.S. Department of Housing and Urban Development carefully tracks all home listings and sales on a monthly basis. 
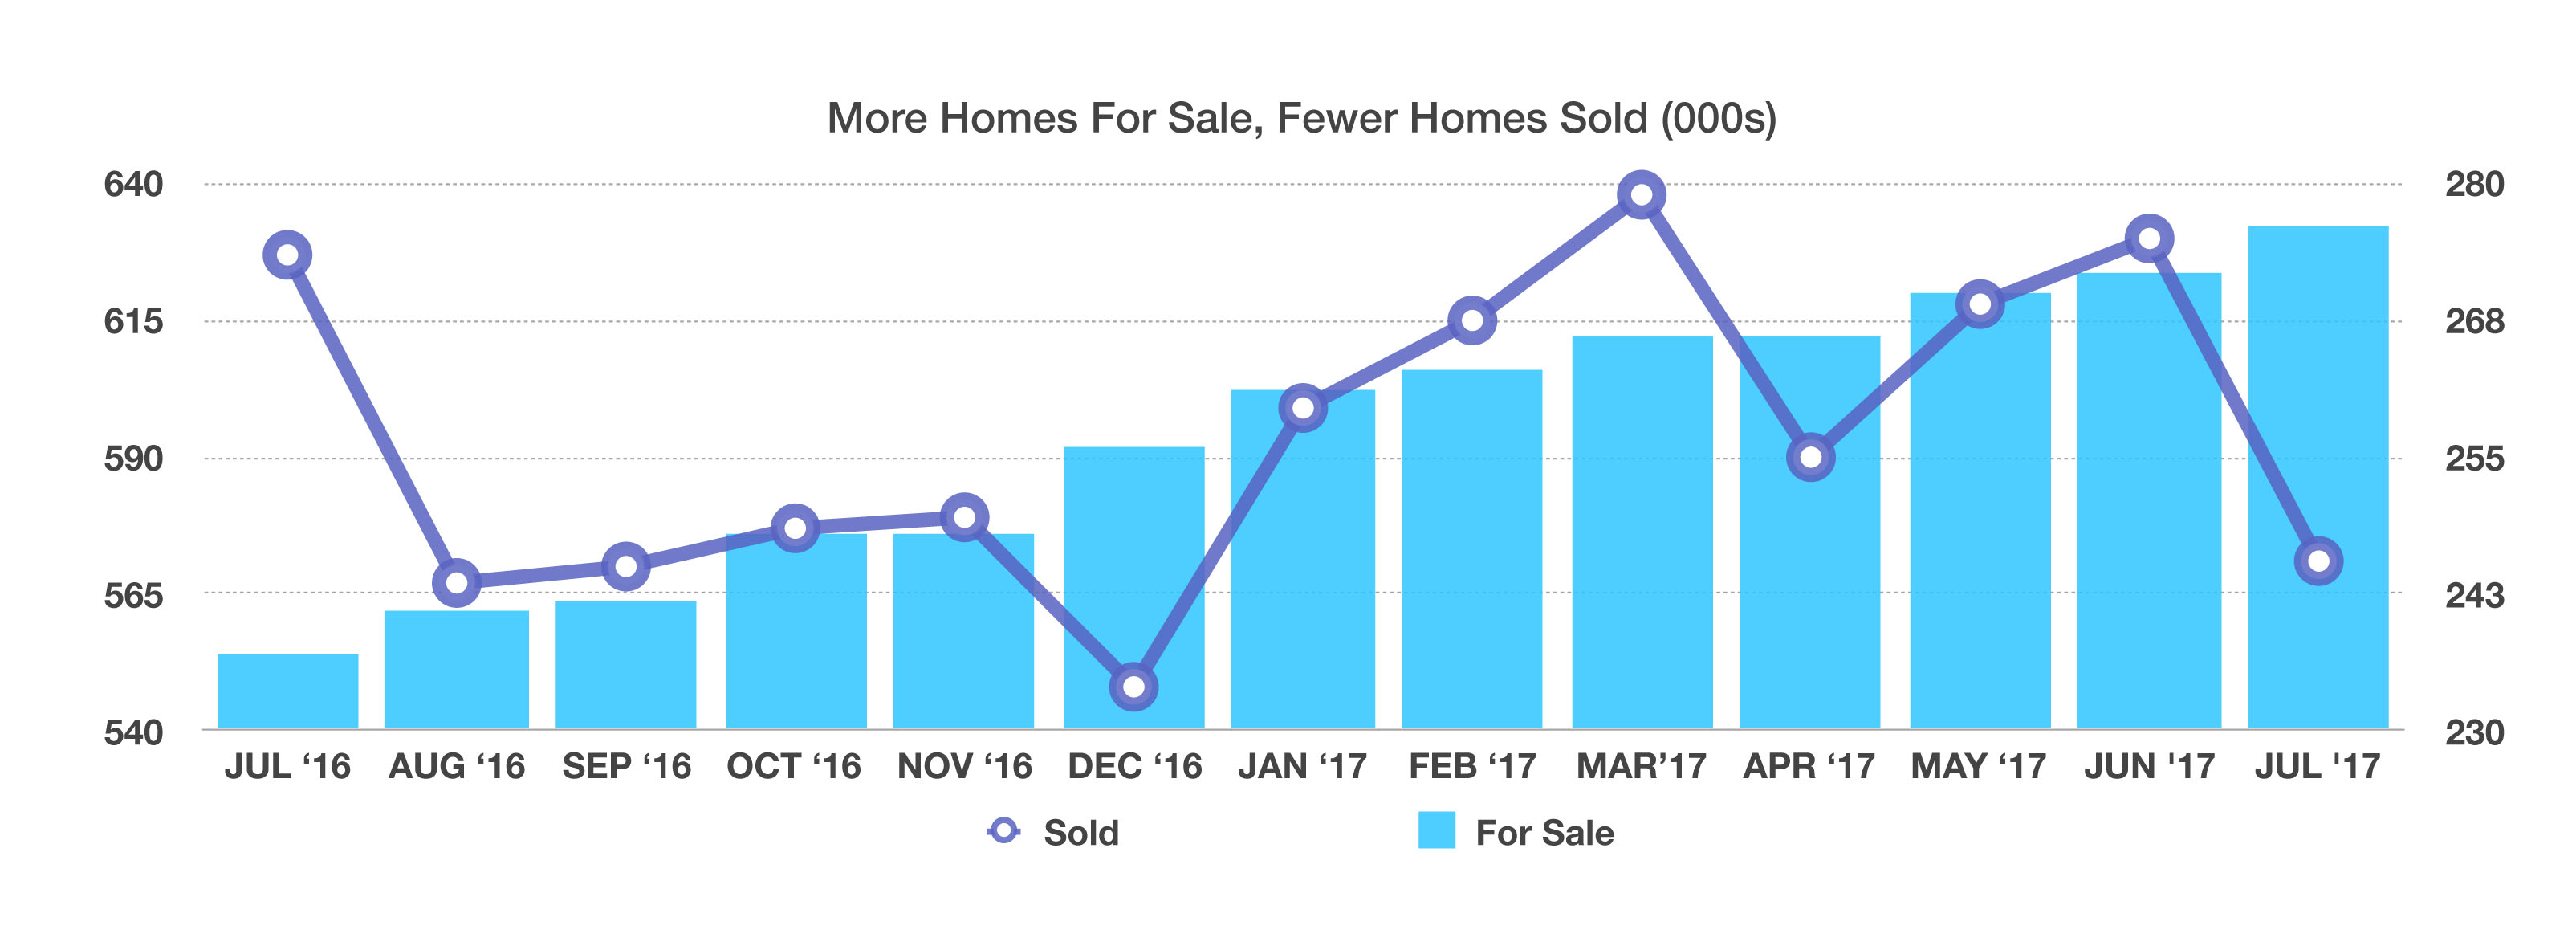
The most recent data available reveals that for the past year, as of July 2017, there was an increase in the number of homes for sale and a decrease in the number of homes sold. At the end of July, there were 276,000 homes for sale while there were 571,000 homes sold. July 2016 saw 627,000 homes sold with only 237,000 homes for sale nationwide. (Sources: U.S. Census Bureau, HUD)


Hurricane Harvey Is Estimated To Cost Over $75 Billion In Losses

Costliest Hurricanes – Historical Note

As flood waters recede in Texas, Hurricane Harvey is on track to be one of the costliest natural disasters in U.S. history. Not since Hurricane Katrina, which ravaged Louisiana in 2005, and Gustav & Ike in 2008, have insurance companies been levied with billions of dollars in settlement claims. Fortunately, nearly nine years absent of a significant natural disaster has allowed insurance carriers nationwide to fortify reserves and issue new policies.

Moody’s estimates that property losses from Hurricane Harvey will total between $45 billion to $65 billion, while economic losses will add $6 billion to $10 billion, totaling $75 billion. Other insurance industry estimates run as high as $100 billion, including uninsured businesses and individuals.

Historically, rebuilding efforts following natural disasters such as hurricanes, has led to pockets of economic growth. The enormous cost of Katrina in 2005 led to hundreds of millions of dollars for rebuilding homes, roads, buildings, and re-establishing businesses. (Sources: NOAA, Dept of Commerce, Moody’s, NASA)

Why Oil Went Down & Gasoline Went Up After Harvey – Energy Overview

Houston, the country’s fourth largest city, is a hub for the nation’s oil refineries. Harvey has resulted in more than 20 percent of refining capacity along the Texas Gulf Coast to cease, and it may take a while to ramp production back up to pre-storm levels. As a central hub of crude oil refineries domestically and internationally, Texas also acts as a critical juncture for pipelines and refineries.

In the aftermath of the hurricane, oil prices fell following a glut of unrefined oil that started to accumulate as refineries shutdown. A shortage of gasoline supplies then developed as refineries failed to produce fresh supplies. It may be weeks before most of the shut down refineries are back online and producing at pre-storm capacity. Gasoline and jet fuel supplies to the east coast were especially susceptible to the closed refineries.

Data from the EIA shows that the average price for all grades of gasoline rose from $2.46 to $2.74 nationwide, while the price of West Texas Intermediate (WTI) crude oil fell from $47.39 to $46.40 per barrel. (Source: EIA)

 
The Debt Ceiling Has Been Raised 79 times Since Its Creation In 1917

How The Debt Ceiling Came About – Historical Note

Formally known as the statutory debt limit, the United States debt ceiling or debt limit is a legislative restriction on the amount of national debt that can be issued by the Treasury. The debt limit has been raised 79 times since its creation in 1917, with 17 of these increases occurring over the past 20 years.

The United States has maintained legislative restriction on debt since 1917. To control the amount of total debt outstanding, Congress has placed restrictions on Federal debt issuance since the passing of the Second Liberty Bond Act of 1917, which eventually evolved into a general debt limit in 1939. The Second Liberty Bond Act of 1917 helped finance the United States’ entry into World War I, which allowed the Treasury to issue long-term Liberty Bonds.

Periodically, a political dispute arises over legislation to raise the debt ceiling. Until the debt ceiling is raised, the Treasury undertakes what is termed as “extraordinary measures”, which essentially buys more time for the ceiling to be raised.

The United States has never reached the point of default, where the Treasury is unable to pay its obligations. In 2011 the United States reached a point of near default, which in turn triggered the first downgrade of U.S. debt by credit rating agencies. Congress raised the debt limit with the Budget Control Act of 2011, which led to the fiscal cliff and set a new debt ceiling that was reached on December 31, 2012. (Source: Congressional Research Service)

Euro Getting Stronger, Dollar Getting Weaker – Currency Update

The euro jumped above 1.20 for the first time in 2 1/2 years, as weaker than expected U.S. economic data boosted European growth forecasts. The common currency has been rising for several months on the expectations that the European Central Bank (ECB) will begin tapering its bond buying program. So far this year the euro has advanced 14% against the U.S. dollar, its strongest performance since its inception in 1999. An elevating euro is a concern for European exporters due to exports heading for the U.S. become more expensive for American consumers.

A weaker U.S. dollar has led to recalculations by analysts expecting to see an increase in U.S. exports and margins as U.S. exports become more competitive in the international marketplace. The U.S. currency has been in a steady decline since the beginning of the year after reaching a 15-year high. 
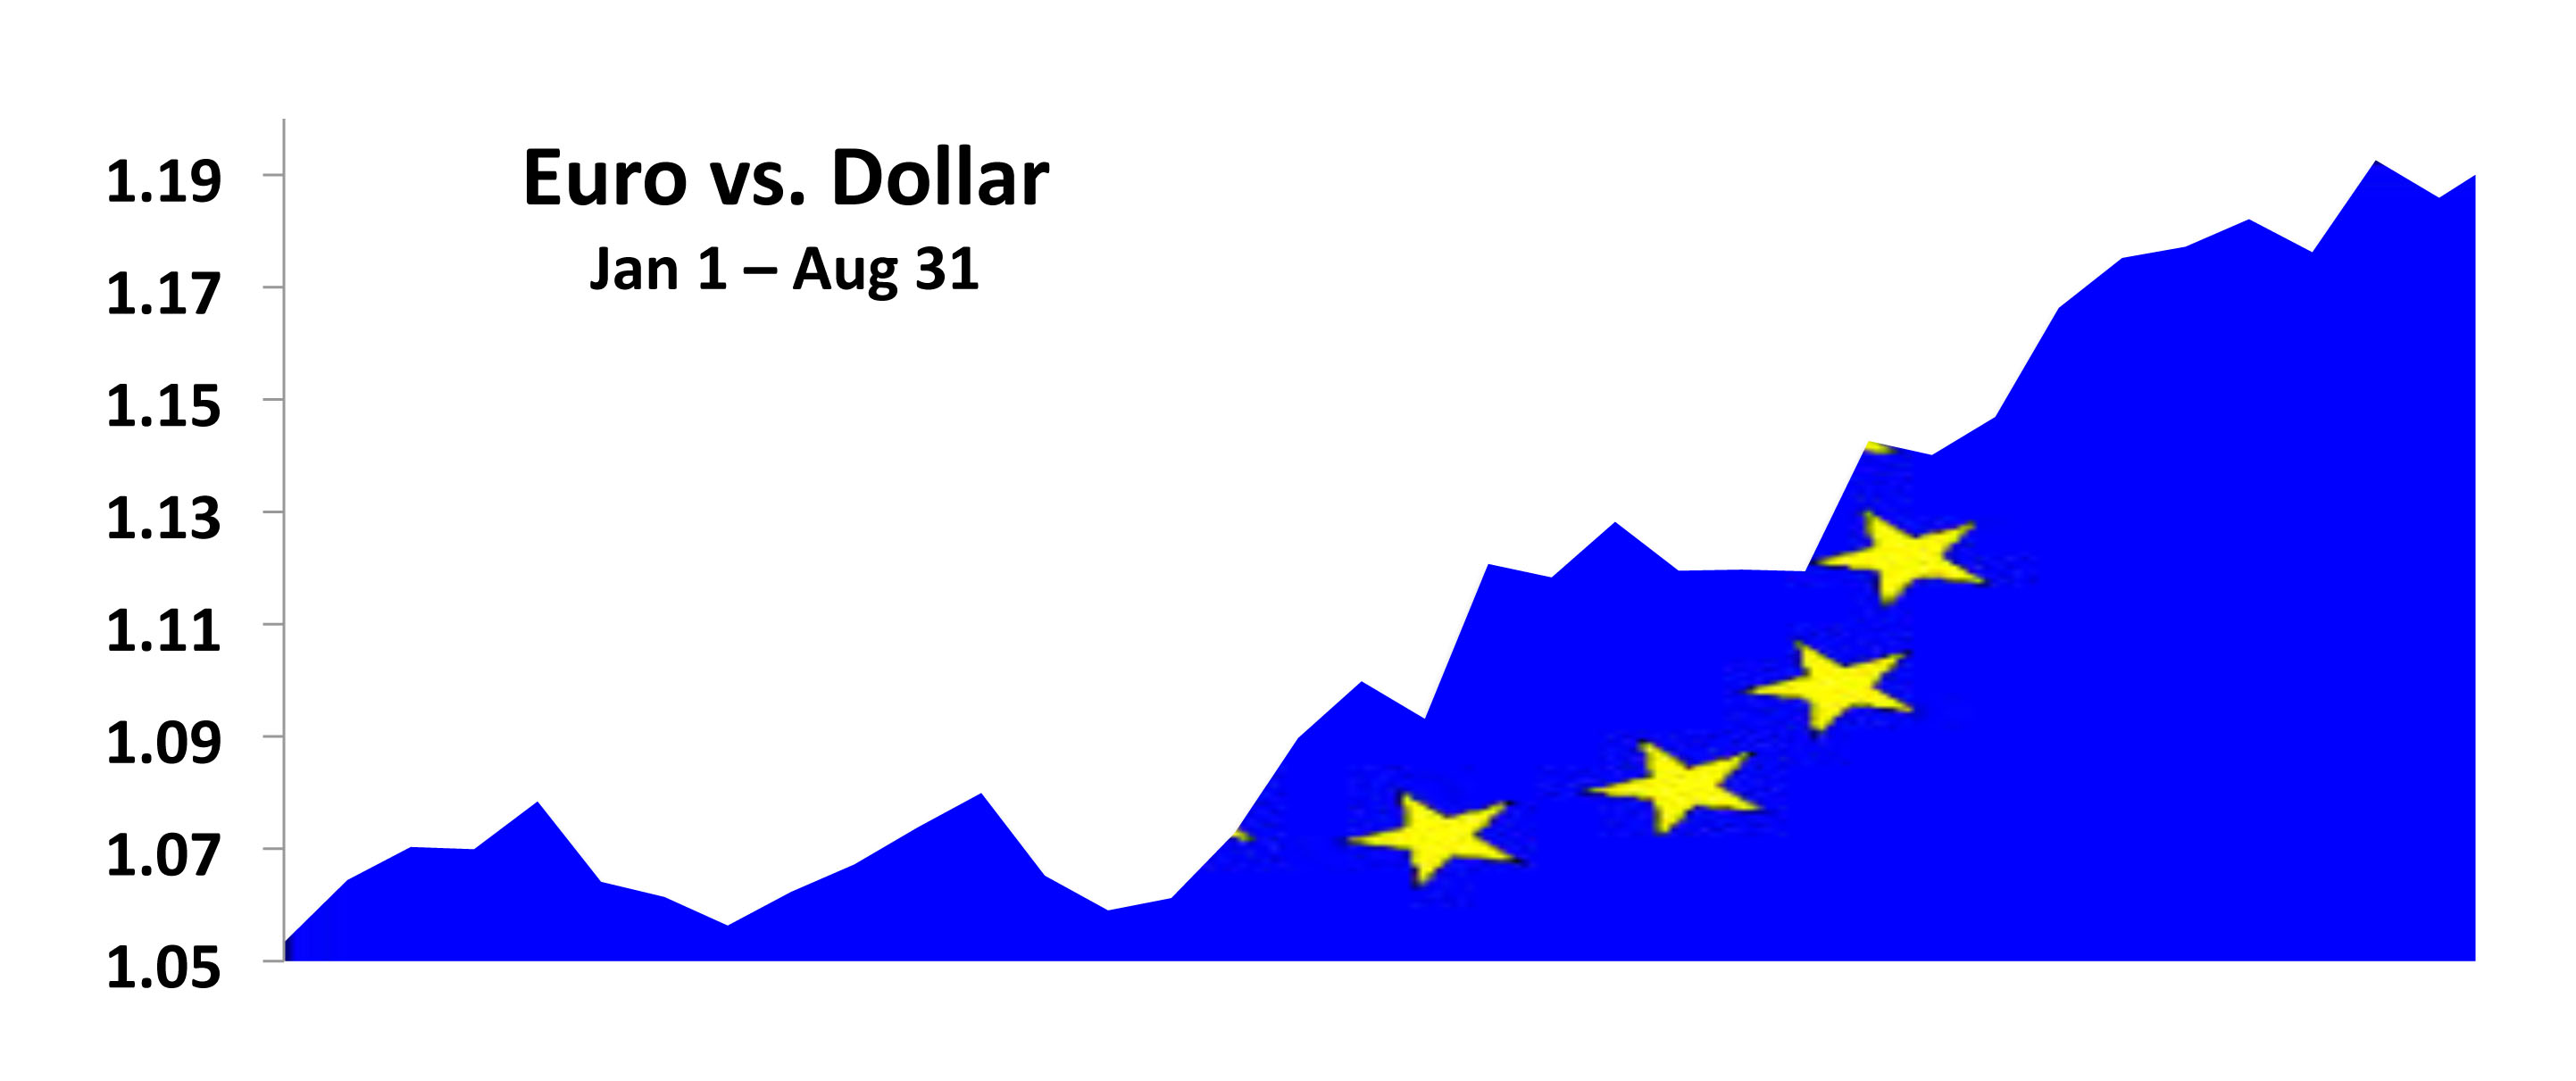
The dollar is down approximately 8% since the beginning of the year versus a basket of major currencies. The decline has been especially pronounced against the Mexican peso, where ongoing NAFTA negations have been a focal point. (Sources: Reuters, Bloomberg)