Ocean Park Capital Management
2503 Main Street
Santa Monica, CA 90405
Main: 310.392.7300
Daily Performance Line: 310.281.8577
Dow Jones | 42,270 |
S&P 500 | 5,911 |
Nasdaq | 19,113 |
2 Yr Treasury | 3.89% |
10 Yr Treasury | 4.41% |
10 Yr Municipal | 3.31% |
High Yield | 7.26% |
Dow Jones | -0.64% |
S&P 500 | 0.51% |
Nasdaq | -1.02% |
MSCI-EAFE | 17.30% |
MSCI-Europe | 21.20% |
MSCI-Pacific | 10.50% |
MSCI-Emg Mkt | 8.90% |
US Agg Bond | 2.45% |
US Corp Bond | 2.26% |
US Gov’t Bond | 2.44% |
Gold | 3,313 |
Silver | 33.07 |
Oil (WTI) | 60.79 |
Dollar / Euro | 1.13 |
Dollar / Pound | 1.34 |
Yen / Dollar | 144.85 |
Canadian /Dollar | 0.72 |
Stocks were modestly higher in August. The Ocean Park funds again outperformed most of the major indices for the month and continue to outperform for the year to date. The technology sector contributed significantly to our gains.
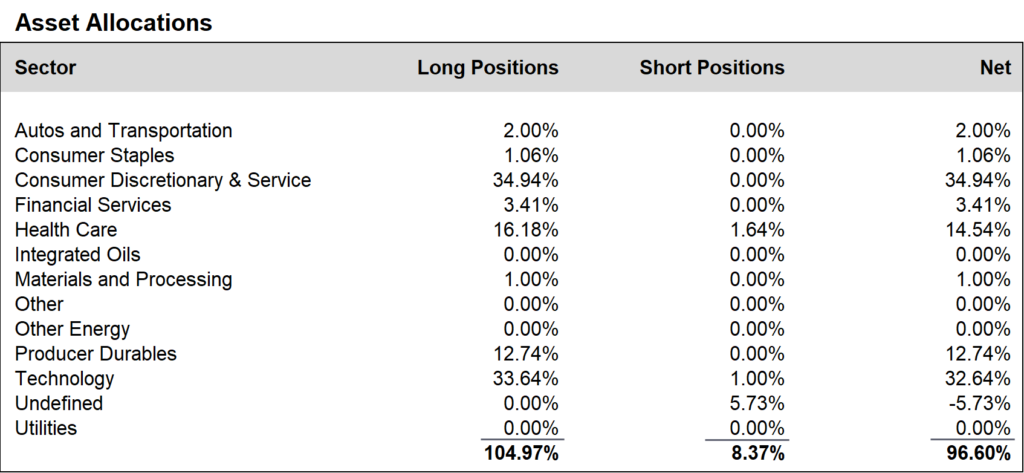
During August, we added to positions in the technology and consumer staples sectors, and reduced positions in the producer durables and materials/ processing sectors. We finished the month at about 97% net long, up from about 92% at the end of July.
A schedule showing the performance of the Investors Fund is included below, along with our Asset Allocation Chart. Daily updates on our activity are available on our Results Line, at
310-281-8577, and current information is also maintained on our website at www.oceanparkcapital.com. To gain access to the site enter password opcap.
*These results are pro forma. Actual results for most investors will vary. See additional disclosures on page 4.
Past performance does not guarantee future results.
As the second quarter earnings season wound down, results continued at a blistering pace. With 91% of S&P 500 companies reporting, the blended growth rate for second quarter earnings rose to 10.2%, which was even higher than the already impressive 9.1% rate at the end of July. Interestingly, companies with more global exposure grew earnings significantly more than companies with more domestic exposure, to the tune of 14.0% to 8.5%. Earnings beats held steady at a 73% pace and revenue beats continued impressive at 69%–both numbers that are well ahead of their 5-year averages. Importantly, future earnings guidance was generally strong.
Continuing the trend for most of 2017, growth stocks outperformed value stocks during the month. Uncharacteristically, earnings surprises did not correlate well with stock performance. Overall, companies with positive earnings surprises lost 0.3% for the period from two days before to two days after their earnings reports.
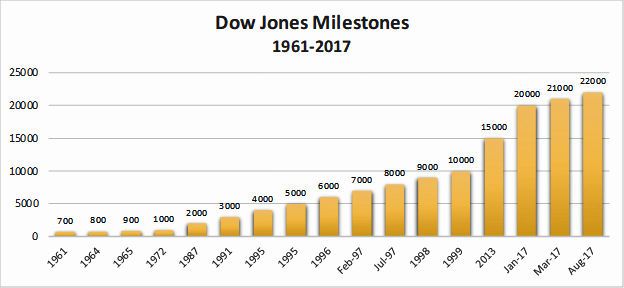
The Dow Jones Industrial Average topped 22,000 for the first time.
Macro Overview
Economic news in August was the usual mixed bag. Manufacturing, unemployment, and retail sales numbers were encouraging, and the Commerce Department revised its estimates of second quarter GDP growth upward from 2.6% to 3.0%–the fastest pace in two years. However, wage growth, the housing market, and durable goods orders were weak.
Hurricane Harvey proved to be one of the most damaging storms in U.S. history, wreaking havoc in Texas and particularly in Houston. Among other catastrophic impacts, it knocked out 20% of the country’s oil refining capacity.
Tax reform remains uncertain, as there appears to be disagreement within the administration on key elements– not to mention a wide range of views among Republicans in Congress. While it appears that there is an appetite for reducing the corporate tax rate, there is consensus that a reduction from 35% to 15%, much ballyhooed by the president in the campaign, is a nonstarter. There was no further word on any plan for infrastructure spending, which appears to be forgotten in the confusion surrounding tax reform.
North Korea continued to dominate international news, as it fired a midrange ballistic missile over northern Japan. The Hermit Kingdom defies all attempts to modify its behavior and remains a conundrum for world leaders, but has had no lasting impact on the stock market.
Additional Disclosures
Performance data for OPI reflect the reinvestment of dividends and other earnings on the fund’s assets. Performance data for the major indices reflect only changes in the value of those indices, and would be higher if dividends were included. However, the index data do not reflect fees that would be paid to index fund managers and transaction costs that would be incurred when their component stocks are bought or sold, while OPI’s data do reflect quarterly fees and expenses incurred by the fund. The information provided is believed to be reliable, but its accuracy or completeness is not warranted. This material is not intended as an offer or solicitation for the purchase or sale of any stock, bond, mutual fund, or any other financial instrument. The views and strategies discussed herein may not be appropriate and/or suitable for all investors. This material is meant solely for informational purposes, and is not intended to suffice as any type of accounting, legal, tax, or estate planning advice. Any and all forecasts mentioned are for illustrative purposes only and should not be interpreted as investment recommendations.