September 2018
Market Update
(all values as of 09.30.2024)

Stock Indices:

Dow Jones 42,330
S&P 500 5,762
Nasdaq 18,189

Bond Sector Yields:

2 Yr Treasury 3.66%
10 Yr Treasury 3.81%
10 Yr Municipal 2.63%
High Yield 6.66%

YTD Market Returns:

Dow Jones 12.31%
S&P 500 20.81%
Nasdaq 21.17%
MSCI-EAFE 12.90%
MSCI-Europe 12.10%
MSCI-Pacific 13.80%
MSCI-Emg Mkt 16.80%
 
US Agg Bond 4.44%
US Corp Bond 5.32%
US Gov’t Bond 4.39%

Commodity Prices:

Gold 2,657
Silver 31.48
Oil (WTI) 68.27

Currencies:

Dollar / Euro 1.11
Dollar / Pound 1.33
Yen / Dollar 142.21
Canadian /Dollar 0.73
 

Macro Overview

Trade and tariffs continued at the forefront of discussions among the U.S. and international trading partners. Topics at hand included the North American Free Trade Agreement (NAFTA), the World Trade Organization (WTO), and protecting U.S. intellectual property rights internationally. 

Emerging market currencies were rattled worldwide as turmoil with Argentina and Turkey spilled over into the broader markets. Contagion concerns spread in late August as Turkey’s currency fell following comments by the European Central Bank (ECB). Argentina saw its currency collapse as it sought immediate financial assistance from the International Monetary Fund (IMF). Contagion refers to the threat of what is occurring in Turkey and Argentina could migrate to other emerging market economies. The brewing financial crisis with Turkey is similar to the government debt crisis that occurred with Greece eight years ago. Recently imposed U.S. sanctions on Russia added to emerging market distress as the Russian ruble weakened versus other major currencies and the U.S. dollar.

The stock market marked its longest period of uninterrupted gains in history, running 3,453 days from the market low on March 9, 2009 during the depths of the financial crisis. Since then, the Dow Jones Industrial Index catapulted from 6,500 to over 25,500 in August, while the S&P 500 sprang from 666 to over 2800.

It has been 10 years since the financial crisis of 2008 when financial markets experienced turbulence not seen in decades. An ultra low interest rate environment ensued for nearly a decade after the Federal Reserve began flooding the financial markets with massive amounts of liquidity in order to stem the crisis at hand. Since then, numerous legislation and regulations were implemented providing safety measures and guidelines.

Viewed as an optimistic indicator for the U.S. economy, inflation rose the most in seven years as consumer prices increased at an annual rate of 2.9%. While inflation is an indicator of economic expansion in the economy, wages are not keeping up with rising prices nationwide.

The Congressional Budget Office (CBO) released its summary of the most recent federal budget as of July. Federal spending increased by $143 billion, attributable to increases in Medicare, Medicaid, and Social Security expenditures. There was also a rise in individual taxes, a result of larger withholdings on paychecks which increased by $32 billion. That increase in withholdings reflects recent increases in wages and salaries, meaning that the economy is possibly experiencing more people working and at higher pay rates.

California is due to become the first state to impose a quota for the inclusion of women on the boards of publicly traded companies headquartered in the state. Other states are expected to follow California’s lead by eventually implementing similar mandates.

Various social media and technology companies are facing criticism and possible regulatory oversight regarding the influence they maintain. Many see that the political and cultural clout held by just a few companies may eventually be of concern. (Sources: ECB, IMF, Dept. of Commerce, Bloomberg, http://www.leginfo.legislature.ca.gov, CBO)
 
The Turkish lira has fallen over 40% year to date versus the U.S. dollar

Equities Maintain Their Resilience – U.S. Equity Markets

A persistent trade dispute between the United States and China has been lingering over the financial markets for some time now. Helping to buoy domestic markets are strong corporate earnings and improving economic data. Earnings from U.S. companies this quarter are being considered the healthiest since the third quarter of 2009 during the financial crisis.

Some U.S. companies are seeing an increase in sales as well as an increase in gross margins, considered optimistic by equity analysts. The continued strength of the U.S. dollar, however, is starting to weigh on earnings for certain companies transacting business overseas.

The administration has proposed altering quarterly reporting for publicly traded U.S. companies to a semi-annual basis. Similar proposals have been made by companies and regulators in the past in order to stem volatility and focus on earnings. Recent news has focused on some companies going private and shedding the regulatory hurdles and burden caused by quarterly reporting.

Sources: Bloomberg, Federal Reserve Bank of St. Louis

Emerging Market Currencies Experience Volatility – International Currency Review

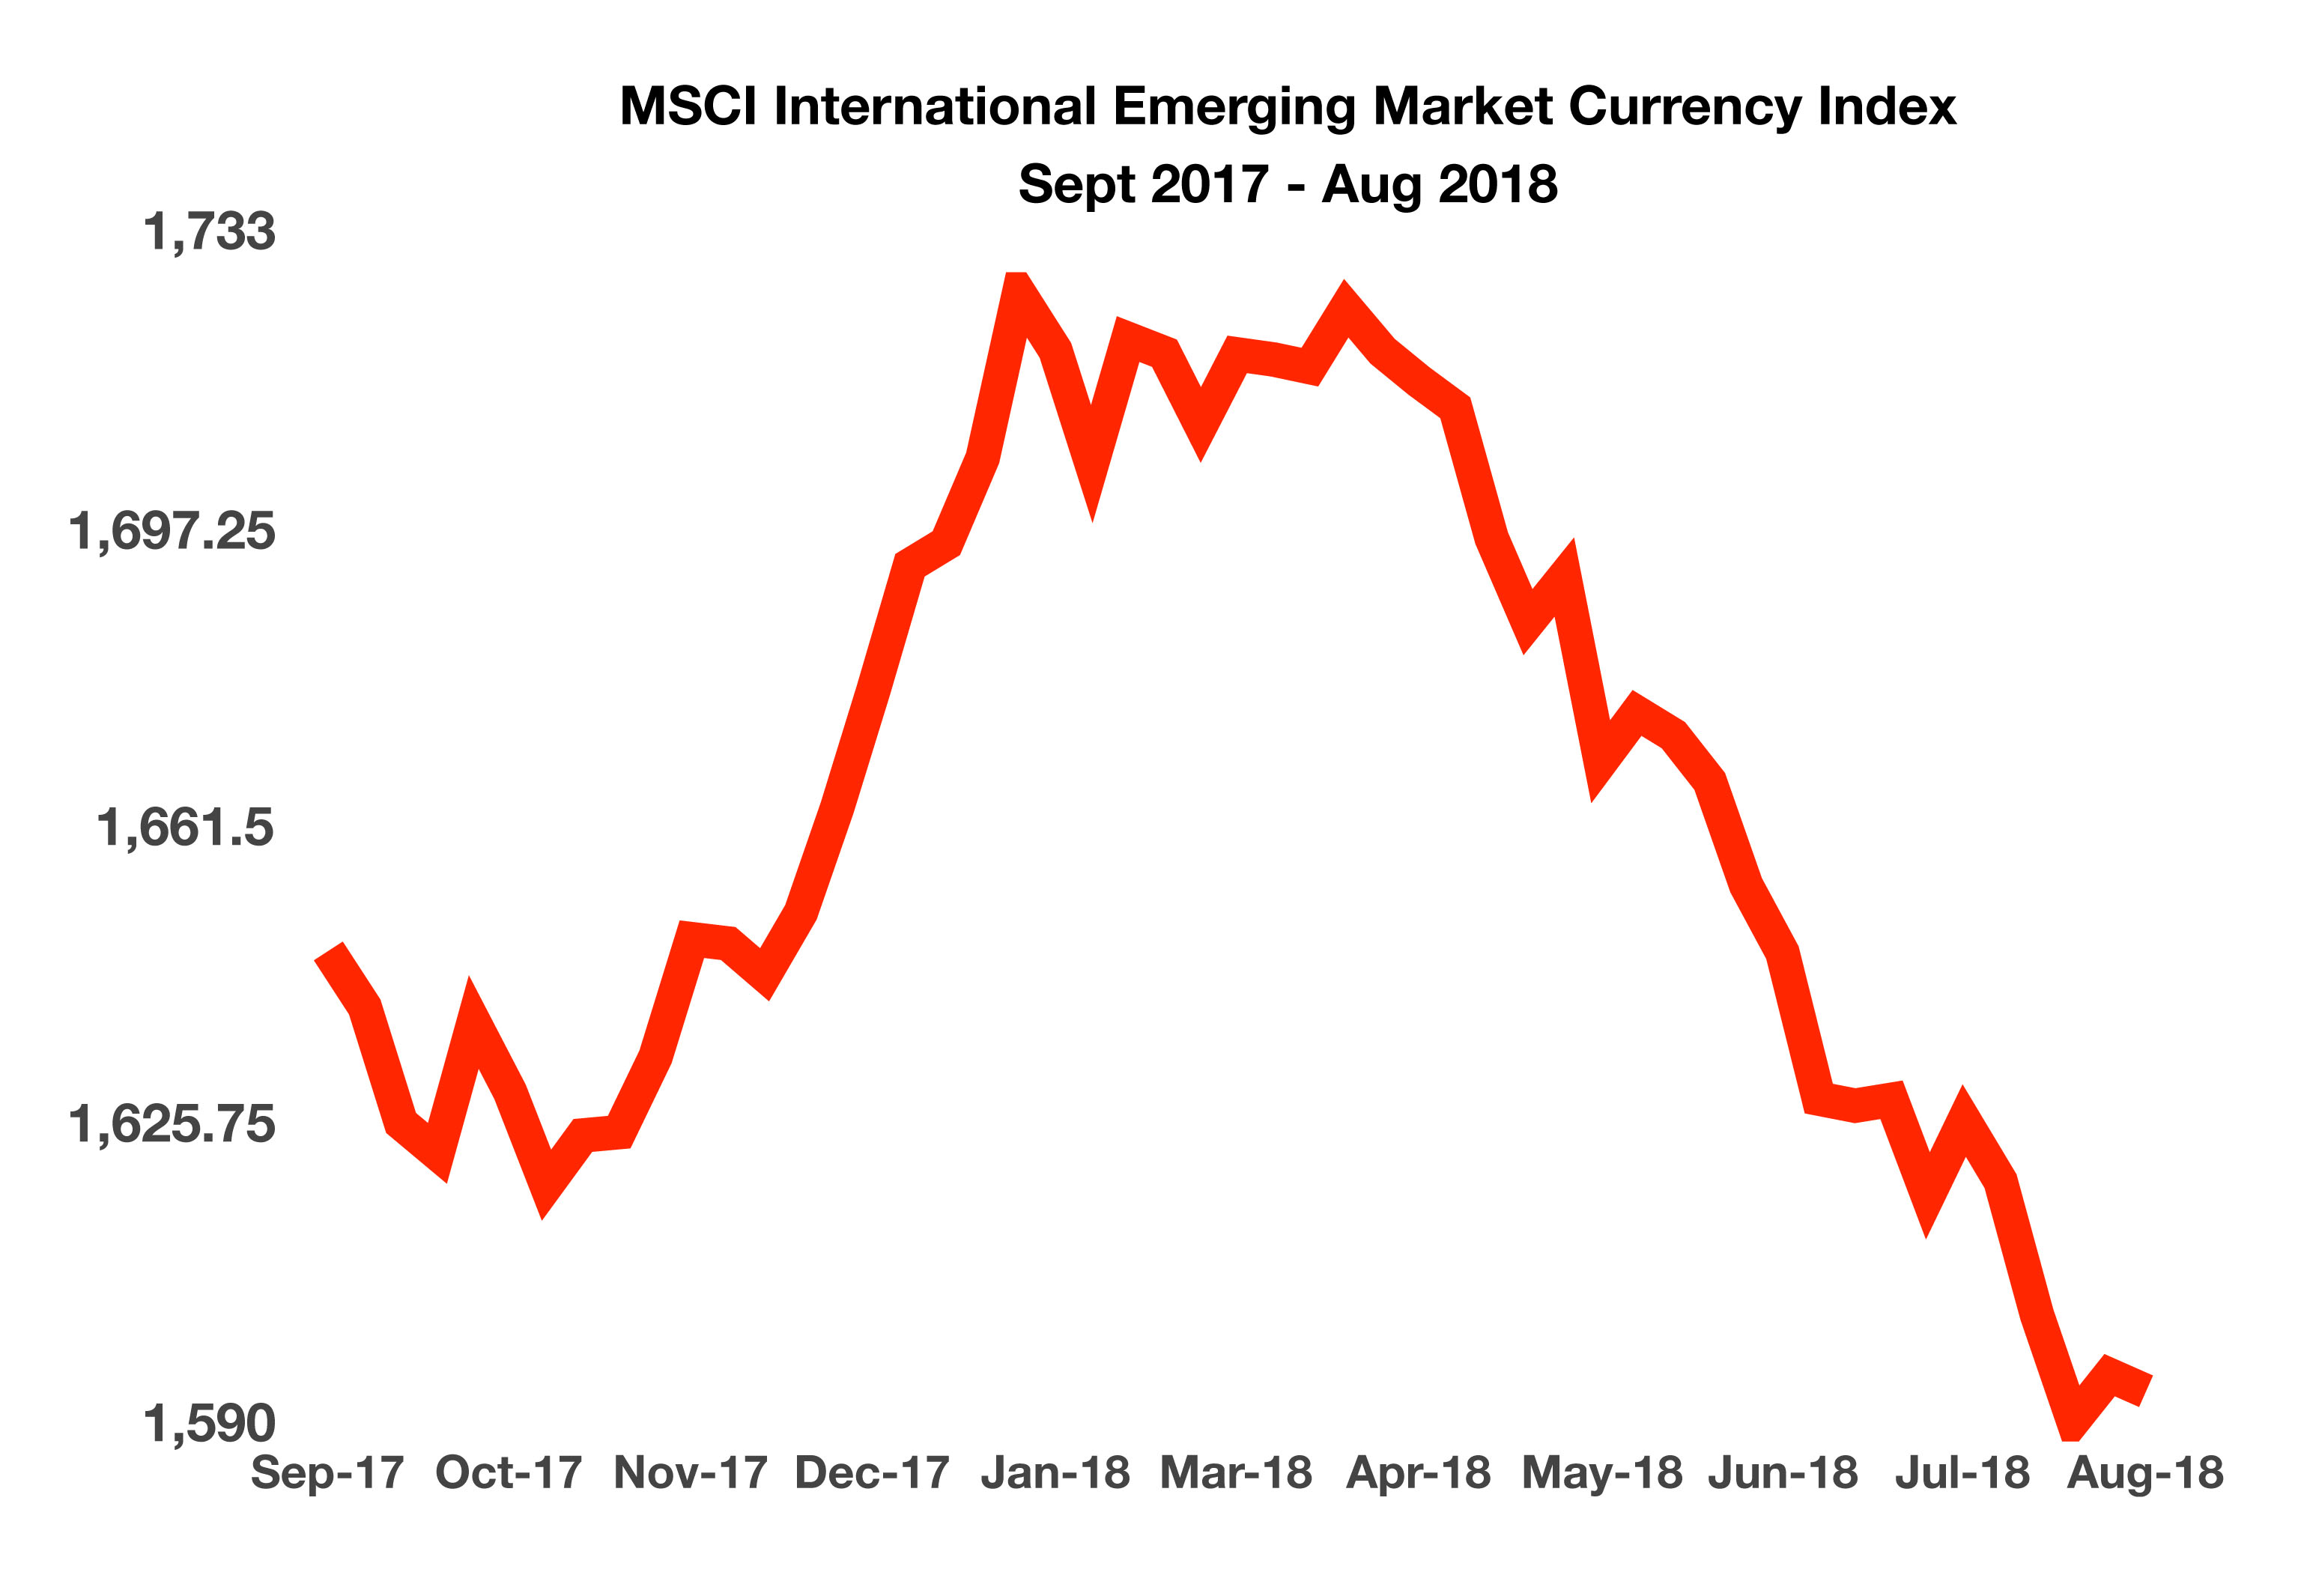
Currency valuations across the emerging markets are being affected by recent financial turmoil in Turkey and Argentina. The Turkish currency, the lira, has fallen over 40% year to date versus the U.S. dollar. The Turkish lira has been the hardest hit so far this year of all of the emerging market currencies. Emerging market currencies, as tracked and measured by the MSCI International Emerging Market Index, has had a continuous decline since the beginning of 2018. 

Concerns about the exposure that European banks have to Turkish bonds became a forefront topic for global bankers. Government spending by Turkey has been equal to that of the government in Greece that led to the country’s debt crisis in 2012. Circumstances that occurred in Greece are appearing in Turkey as mounting government debt has hindered the government’s finances and integrity.

The Argentine peso has lost over half its value versus the U.S. dollar so far this year. A sell-off in the Argentine currency was exacerbated when the president of Argentina asked the International Monetary Fund to speed up its release of $50 billion in bailout funds for the country.

Ironically, the economic growth and strength of the U.S. dollar has been a catalyst for emerging market currency turmoil. The problem lies with dollar denominated debt owed by emerging market countries such as Turkey, Greece, Argentina, and Venezuela. As the U.S. dollar appreciates versus the currencies of these other countries, the cost to repay the debt increases. 

Large international banks and institutional holders of emerging market debt buy insurance to protect themselves from default, should countries become unable to pay their debt. The insurance is known as credit default swaps or CDSs. The cost of insuring debt against a default has risen for various countries over the past few months, most notably Lebanon, Turkey, Pakistan, and Argentina. (Sources: Bloomberg, Reuters, FRED, IMF)

 
95% of Americans own a cellular phone and pay a monthly service fee

Yields Continue To Flatten – Fixed Income Update

A flattening Treasury yield curve remained a focal topic among fixed income analysts in August. The shrinking spread, or difference, between the yield on the 2-year Treasury note and the 10-year Treasury bond reached levels not seen since 2007. The interpretation is that longer term economic growth is expected to be muted, which is reflected in the yield of the 10 year Treasury. The Federal Reserve is still on course for additional rate hikes, but at a very gradual pace.

Ten years have passed since the financial crisis that began in September 2008 when the Federal Reserve flooded the financial markets with massive amounts of liquidity in order to stem the crisis at hand. An ultra low interest rate environment followed for nearly a decade before the Fed reversed course and started raising rates once again.

The Federal Reserve mentioned during one of its meetings in August that it had determined when a prolonged period of low volatility exists, an increase in lending and risk-taking ensures.

Sources: U.S. Treasury, Bloomberg

Wireless Rates Are Due To Climb – Consumer Expenditures

Cell phone bills are rising across the country as providers eliminate promotions and consolidate operations. The announcement of recent mega mergers in the industry has reduced the number of providers and lessened competition, leading to increased rates for customers.

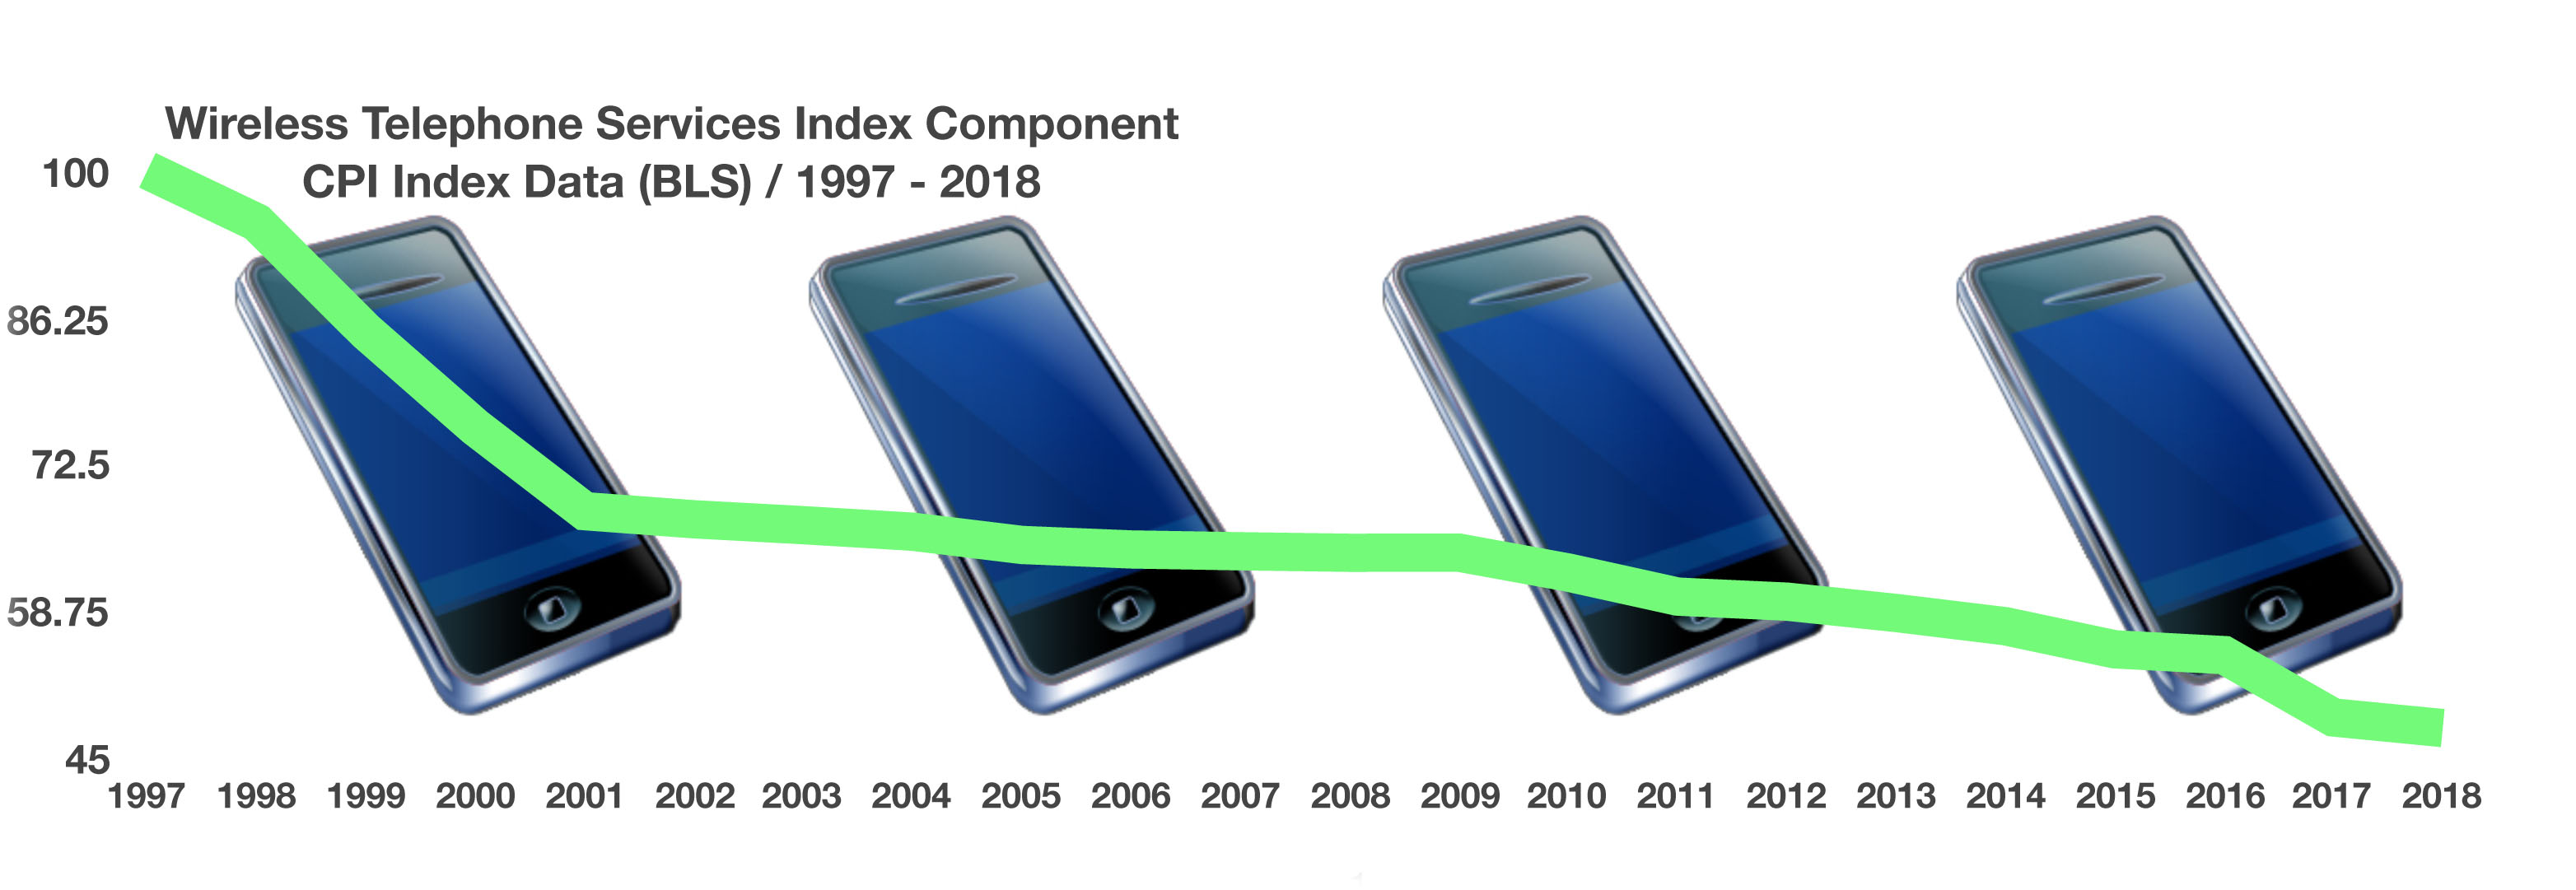
As tracked by the Labor Department’s Consumer Price Index (CPI), the cost of cell phone service is a measurable component of the index. Over the years, cell phone costs have become a vital and expensive service for consumers nationwide, almost as important as groceries or rent. It is estimated that roughly 95% of Americans own a cellular phone and pay a monthly service fee to one of several providers.

Following years of technological advancement and intense competition for market share, cellular providers kept rates low. Adjusted for inflation, cell rates have consistently fallen in price since 1997, meaning that as the price for other services rose, cellular rates fell.

The recent mergers and expansion of new cellular infrastructure has begun to raise rates. Rather than absorbing merger costs and infrastructure build out, cellular service providers are instead passing along the costs to consumers. The higher fees are considered inflationary and thus add to the overall inflationary pressures that are gradually rising.

Sources: BLS, Labor Department, https://www.bls.gov/news.release/cpi.nr0.htm


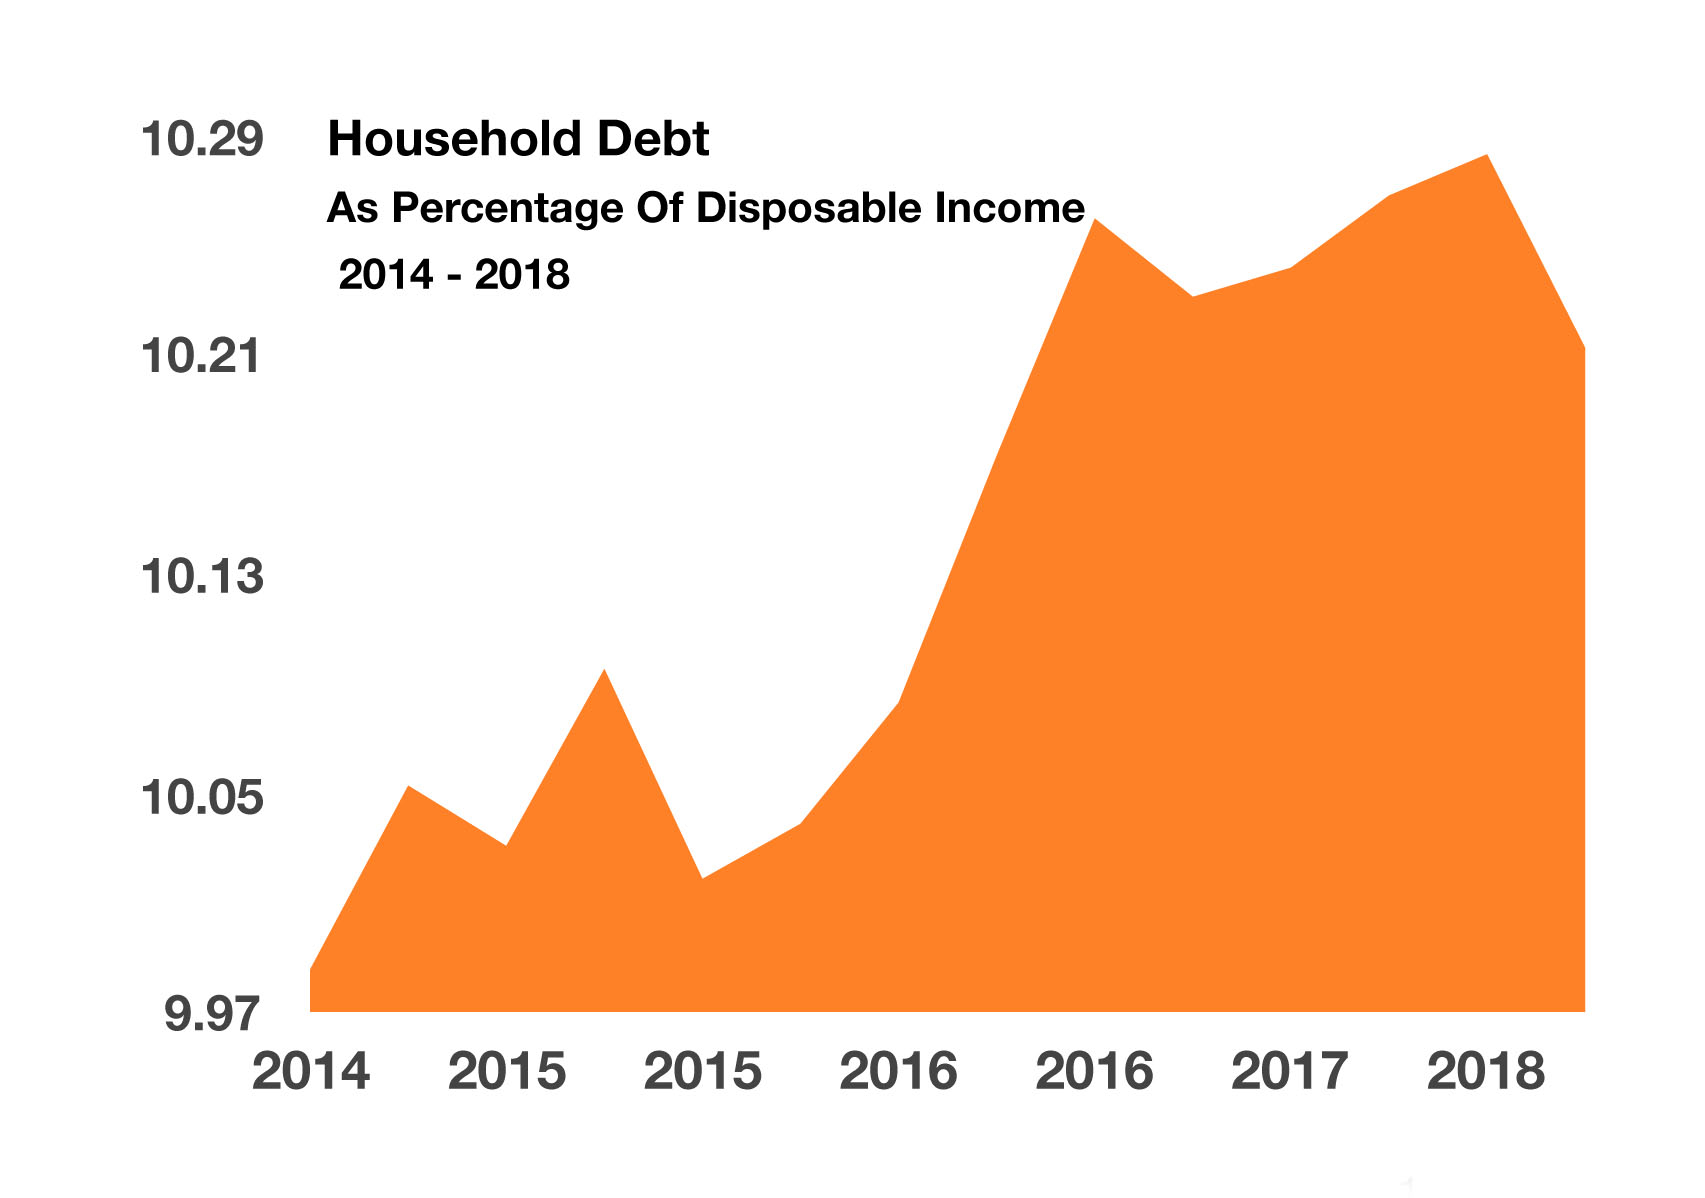
households spend about 10.21% of their disposable income on debt payments

Households Holding Less Debt – Consumer Behavior

The New York Federal Reserve Bank compiles data on how much debt and what type of debt households have. The most recent release of debt data shows that household debt as a percentage of disposable income fell to the lowest levels since 2002. Debt payments include loans on autos, mortgages, education, and credit card balances.

The data shows that households are seeing less debt payments as a percentage of disposable income. Economists view the recent data from different perspectives. Optimistically consumers may be scaling back on debt payments and thus have more free cash to spend on goods, services, or savings. Pessimistically, consumers may be in the beginning stages of cutting back on borrowing, thus reflecting less confidence in their future income and/or overall financial position.

Either way, holding less debt in a rising interest rate environment is good for consumers since they are saving on the higher costs incurred from rising interest rates. The most recent data shows that households spend about 10.21% of their disposable income on debt payments, a slight decrease from levels over the past two years. (Source: New York Federal Reserve Bank)

Leading Scams Targeting Seniors – Retirement Planning

The National Council on Aging estimates that nearly 1 in 10 Americans over the age of 60 experiences some form of financial elder abuse. 

IRS Scams: Callers claiming to be IRS agents often call unsuspecting seniors at home, accusing them of owing back taxes and having to pay immediately. The IRS impersonators threaten to foreclose on homes, garnish social security, and even threaten arrest unless payment is made immediately by phone. The IRS never makes outing calls to anyone, all correspondence is done via USPS or the IRS secured internet site. In addition, the IRS will never ask for payment information over the phone nor demand immediate payment. 

Technology & Internet Fraud: Phone calls from individuals claiming to be from a major technology company target seniors. Callers ask for remote access to computers in order to gather sensitive data and financial details.  Pop-up ads claiming to fix pop-up ads many times are fraudulent advertisements used to gather credit card numbers and personal details.

Sweepstakes Scam: Unreasonable or ridiculous calls regarding a prize or major sweepstakes winnings.

Other Scams: Fake charities and relatives needing money. Be sure to review bank and credit card statements carefully for fraudulent or suspicious activity. If fraud is suspected, it is suggested to contact credit bureaus and relatives. (Sources: National Council On Aging, IRS.gov)

 
important lessons before heading back into the investing classroom

The ABCs of Education Investing

With school back in session in most of the country, many parents are likely thinking about how best to prepare for their children’s future college expenses.

THE CALCULUS OF PLANNING FOR FUTURE COLLEGE EXPENSES
According to recent data published by the College Board, the annual cost of attending college in the US in 2017–2018 averaged $25,290 at public schools, plus an additional $15,650 if one is attending from out of state. At private schools, tuition and fees averaged $50,900.

These figures are averages, meaning actual costs will be higher at certain schools and lower at others. Additionally, these figures do not include the potential benefit of scholarships and other types of financial aid. As a result, actual education costs can vary considerably from family to family.

Figure 1: Average Estimated Full-Time Undergraduate Budgets (Enrollment-Weighted) by Sector, 2017-18
Sector Tuition & Fees Room & Board Books & Supplies Transportation & Other expenses Total Expenses*
Public Two-Year In-District Commuter $3,570 $8,400 $1,420 $4,190 $17,580
Public Four-Year In-State On-Campus $9,970 $10,800 $1,250 $3,270 $25,290
Public Four-Year Out-of-State On-Campus $25,620 $10,800 $1,250 $3,270 $40,940
Private Nonprofit Four-Year On-Campus $34,740 $12,210 $1,220 $2,730 $50,900
NOTES: Expense categories are based on institutional budgets for students as reported in the College Board’s Annual Survey of Colleges. Figures for tuition and fees and room and board mirror those reported in Table 1. Other expense categories are the average amounts allotted in determining the total cost of attendance and do not necessarily reflect actual student expenditures.
SOURCES: College Board, Annual Survey of Colleges; NCES, IPEDS Fall 2015 Enrollment data. This table was prepared in October 2017.

To complicate matters further, the amount of goods and services $1 can purchase tends to decline over time. This is called inflation. One measure of inflation looks at changes in the price level of a basket of goods and services purchased by households, known as the Consumer Price Index (CPI). Tuition, fees, books, food, and rent are among the goods &nd services included in the CPI basket. In the US over the past 50 years, inflation measured by this index has averaged around 4% per year. With 4% inflation over 18 years, the purchasing power of $1 would decline by about 50%. If inflation were lower, say 3%, the purchasing power of $1 would decline by about 40%. If it were higher, say 5%, it would decline by around 60%.

While we do not know what inflation will be in the future, we should expect that the amount of goods and services $1 can purchase will decline over time. Going forward, we also do not know what the cost of attending college will be. But again, we should expect that education costs will likely be higher in the future than they are today. So, what can parents do to prepare for the costs of a college education? How can they plan for and make progress toward affording those costs?

[continued on page 6]

 
broad diversification is essential for risk management

[The ABCs of Education Investing continued from page 5]

DOING YOUR HOMEWORK ON INVESTING
To help reduce the expected costs of funding future college expenses, parents can invest in assets that are expected to grow their savings at a rate of return that outpaces inflation. By doing this, college expenses may ultimately be funded with fewer dollars saved. Because these higher rates of return come with the risk of capital loss, this approach should make use of a robust risk management framework. Additionally, by using a tax-deferred savings vehicle, such as a 529 plan, parents may not pay taxes on the growth of their savings, which can help lower the cost of funding future college expenses.

While inflation has averaged about 4% annually over the past 50 years, stocks (as measured by the S&P 500 Index) have returned around 10% annually during the same period. Therefore, the “real” (inflation-adjusted) growth rate for stocks has been around 6% per annum. Looked at another way, $10,000 of purchasing power invested at this rate over the course of 18 years would result in over $28,000 of purchasing power later on. We can expect the real rate of return on stocks to grow the purchasing power of an investor’s savings over time. We can also expect that the longer the horizon, the greater the expected growth. By investing in stocks, and by starting to save many years before children are college age, parents can expect to afford more college expenses with fewer savings.

It is important to recognize, however, that investing in stocks also comes with investment risks. Like teenage students, investing can be unpredictable, full of surprises, and, if one is not careful, expensive. While sometimes easy to forget during periods of increased uncertainty in capital markets, volatility is a normal part of investing. Tuning out short-term noise is often difficult to do, but historically, investors who have maintained a disciplined approach over time have been rewarded for doing so.

RISK MANAGEMENT & DIVERSIFICATION: FRIENDS YOU SHOULD ALWAYS SIT WITH AT LUNCH

A key part of maintaining this discipline throughout the investing process is starting with a well-defined investment goal. This allows for investment instruments to be selected that can reduce uncertainty with respect to that goal. When saving for college, risk management assets (e.g., bonds) can help reduce the uncertainty of the level of college expenses a portfolio can support by enrollment time. These types of investments can help one tune out short‑term noise and bring more clarity to the overall investment process. As kids get closer to college age, the right balance of assets is likely to shift from high expected return growth assets to risk management assets.

Diversification is also a key part of an overall risk management strategy for education planning. Nobel laureate Merton Miller used to say, “Diversification is your buddy.” Combined with a long-term approach, broad diversification is essential for risk management. By diversifying an investment portfolio, investors can help reduce the impact of any one company or market segment negatively impacting their wealth. Additionally, diversification helps take the guesswork out of investing. Trying to pick the best performing investment every year is a guessing game. We believe that by holding a broadly diversified portfolio, investors are better positioned to capture returns wherever those returns occur.

CONCLUSION
Higher education may come with a high and increasing price tag, so it makes sense to plan well in advance. There are many unknowns involved in education planning, and no “one-size-fits-all” approach can solve the problem. By having a disciplined approach toward saving and investing, however, parents can remove some of the uncertainty from the process. A trusted advisor can help parents craft a plan to address their family’s higher education goals.

 
Headline-grabbing commentary somehow sounds important, doesn’t it?

What Is the Yield Curve?

… the Treasury yield curve continues to flatten—historically, a harbinger of a slower economy. The spread, or difference, in the yields of the Treasury’s two- and 10-year notes, to under 20 basis points, is the smallest since July 2007… Barrons Up & Down Wall Street Column 8/27/18

The yield curve is flattening (or growing steeper)! … Yield curve spreads are widening (or narrowing)! … The yield curve has inverted (or normalized)!

Headline-grabbing yield curve commentary somehow sounds important, doesn’t it? But what is a yield curve to begin with, and what does it have to do with you and your investments?

A Tour Around the Curve
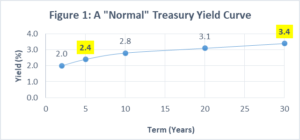
Yield curves typically depict the various yields across the range of maturities for a particular bond class. For example, Figure 1 would inform us that a U.S. Treasury bond with a 5-year maturity was yielding 2.4% annually, while a 30-year Treasury bond was yielding 3.4%.

Bond class – A bond class or type is typically defined by its credit quality. Backed by the full faith of the U.S. government, U.S. Treasury yield curves are among the most frequently referenced, and often the high-quality benchmark against which other bond types are compared – such as municipal bonds, corporate bonds, or other government instruments.
Term/Maturity – The data points along the bottom X axis of a yield curve represent various terms available for a bond class. The term is the length of time you’d need to hold a bond before your loan matures and you should receive your initial investment back.

Yield – The data points along the vertical Y axis represent the interest rate, or yield to maturity currently being offered – such as 2% per year, 3% per year, and so on. The yield curve for any given bond class changes every time its yield changes … which can be frequently.

Spread – The spread is the difference between the annual yields on two bond maturities. So, in Figure 1, there’s a 1% spread between 5-year (2.4%) and 30-year (3.4%) Treasury bond yields.

Define “Normal”
Next, let’s look at the curve itself – i.e., the line that connects the data points just discussed.

The shape of the yield curve helps us see the relationship between various term/yield combinations available for any given bond class at any given point in time.

Just as our body temperature is optimal around 98.6°F (37°C), there’s a preferred equilibrium between bond market terms and yields. “Normal” occurs when short-term bonds are yielding less than their longer-term counterparts. Under normal economic conditions, investors expect to be compensated with a term premium for taking the incremental risk of owning longer maturities. They’re accepting more uncertainty about how current prices will compare to future possibilities. Conversely, they’ll accept lower rates for shorter-term instruments, offering greater certainty. [continued on next page]

 
yield curve reflects evolving investor sentiments

[What is the Yield Curve continued from prior page]

At the same time, evidence suggests there’s often a law of diminishing returns at play. Typically, the further out you go on the yield curve, the less extra yield is available. Thus, Figure 1 depicts a relatively normal yield curve, with a bigger jump to higher returns early in the curve (a steeper spread) and a more gradual ascent (narrower spread) as you move outward in time.

Variations on the Curve
If Figure 1 depicts a normal yield curve, what happens when things aren’t so normal, which is so often the case in our fast-moving markets?

The shape of the yield curve essentially reflects evolving investor sentiments about unfolding economic conditions.

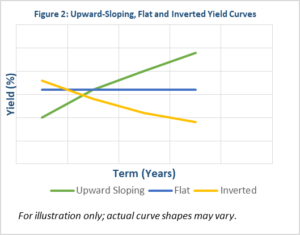
In short, expectations theory suggests that the yield curve reflects investor expectations of future interest rates at any given point in time. Thus, if investors in aggregate expect rates to rise (fall), the yield curve will slope upward (downward). If they expect rates to remain unchanged, it will be flat. Figure 2 depicts three different curve shapes that can result.

The Yield Curve and Your Investments
It’s rare for the yield curve to invert, with long-term yields dropping lower than short-term. But it happens. This typically is the result of the Federal Reserve (or another country’s central bank) tightening monetary policy, i.e., driving up short-term rates to fight inflation. An inverted yield curve is often followed by a recession – although not always immediately, and not always universally.

Does this mean you should head for the hills if the yield curve inverts or takes on other “abnormal” shapes? Probably not. At least not in reaction to this single economic indicator.

As with any other data source, bond yield curves are best employed to inform and sustain your durable, evidence-based investment plans, rather than to tempt you into abandoning those plans every time bond rates make a move. Big picture, bonds are a good tool for dampening that bumpier ride in equities and serving as a safety net for when market risks are realized. They can also contribute modestly to a portfolio’s overall expected returns, but we don’t consider this to be their primary role.

Because the main goal for fixed income is to preserve wealth rather than stretch for significant additional yield, we typically recommend turning to high-quality, short- to medium-term bonds that appropriately manage the term, credit and call risk. (Call risk is realized if the bond issuer “calls” or pays off their bond before it matures, which usually forces the bond’s investors to accept lower rates if they want to remain invested in the bond market.)

Similar principles apply, whether investing directly in individual bonds or via bond funds.