AIS September 2018 Newsletter
Market Update
(all values as of 04.30.2024)

Stock Indices:

Dow Jones 37,815
S&P 500 5,035
Nasdaq 15,657

Bond Sector Yields:

2 Yr Treasury 5.04%
10 Yr Treasury 4.69%
10 Yr Municipal 2.80%
High Yield 7.99%

YTD Market Returns:

Dow Jones 0.34%
S&P 500 5.57%
Nasdaq 4.31%
MSCI-EAFE 1.98%
MSCI-Europe 2.05%
MSCI-Pacific 1.82%
MSCI-Emg Mkt 2.17%
 
US Agg Bond 0.50%
US Corp Bond 0.56%
US Gov’t Bond 0.48%

Commodity Prices:

Gold 2,297
Silver 26.58
Oil (WTI) 81.13

Currencies:

Dollar / Euro 1.07
Dollar / Pound 1.25
Yen / Dollar 156.66
Canadian /Dollar 0.79
 

Macro Overview

Trade and tariffs continued at the forefront of discussions among the U.S. and international trading partners. Topics at hand included the North American Free Trade Agreement (NAFTA), the World Trade Organization (WTO), and protecting U.S. intellectual property rights internationally. 

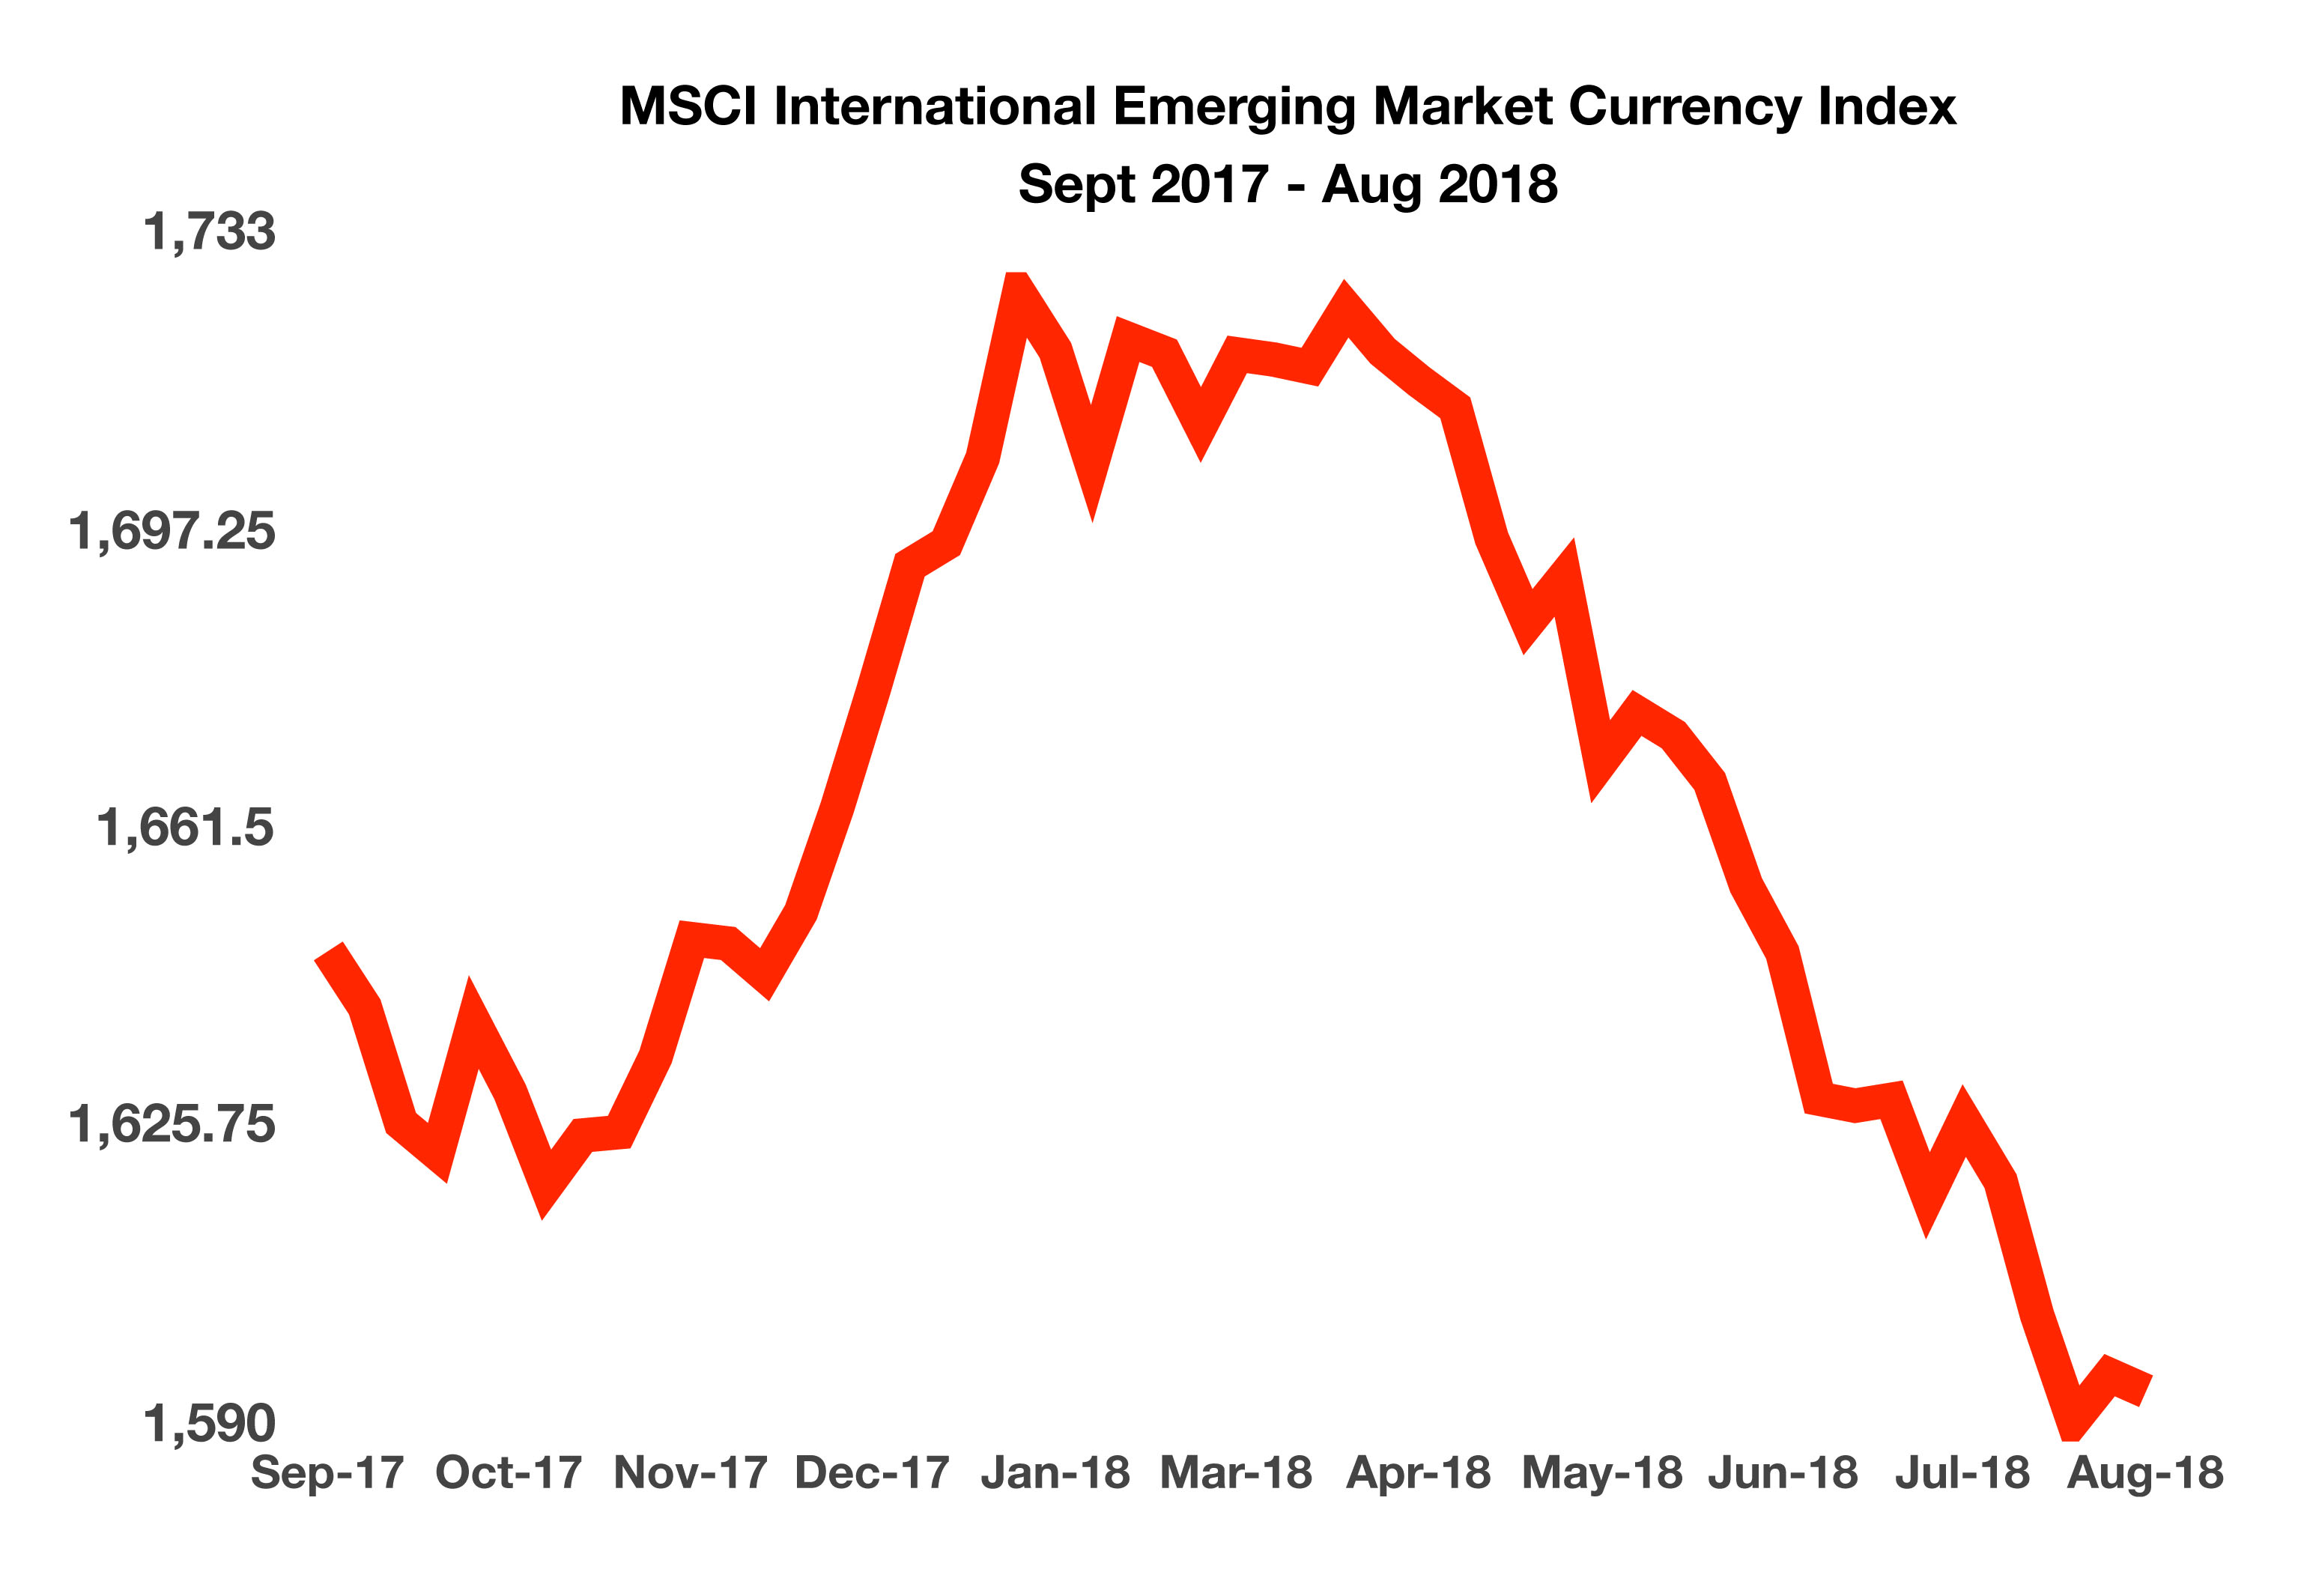
Emerging market currencies were rattled worldwide as turmoil with Argentina and Turkey spilled over into the broader markets. Contagion concerns spread in late August as Turkey’s currency fell following comments by the European Central Bank (ECB). Argentina saw its currency collapse as it sought immediate financial assistance from the International Monetary Fund (IMF). Contagion refers to the threat of what is occurring in Turkey and Argentina could migrate to other emerging market economies. The brewing financial crisis with Turkey is similar to the government debt crisis that occurred with Greece eight years ago. Recently imposed U.S. sanctions on Russia added to emerging market distress as the Russian ruble weakened versus other major currencies and the U.S. dollar.

The stock market marked its longest period of uninterrupted gains in history, running 3,453 days from the market low on March 9, 2009 during the depths of the financial crisis. Since then, the Dow Jones Industrial Index catapulted from 6,500 to over 25,500 in August, while the S&P 500 sprang from 666 to over 2800.

It has been 10 years since the financial crisis of 2008 when financial markets experienced turbulence not seen in decades. An ultra low interest rate environment ensued for nearly a decade after the Federal Reserve began flooding the financial markets with massive amounts of liquidity in order to stem the crisis at hand. Since then, numerous legislation and regulations were implemented providing safety measures and guidelines.

Viewed as an optimistic indicator for the U.S. economy, inflation rose the most in seven years as consumer prices increased at an annual rate of 2.9%. While inflation is an indicator of economic expansion in the economy, wages are not keeping up with rising prices nationwide.

The Congressional Budget Office (CBO) released its summary of the most recent federal budget as of July. Federal spending increased by $143 billion, attributable to increases in Medicare, Medicaid, and Social Security expenditures. There was also a rise in individual taxes, a result of larger withholdings on paychecks which increased by $32 billion. That increase in withholdings reflects recent increases in wages and salaries, meaning that the economy is possibly experiencing more people working and at higher pay rates.

California is due to become the first state to impose a quota for the inclusion of women on the boards of publicly traded companies headquartered in the state. Other states are expected to follow California’s lead by eventually implementing similar mandates.

Various social media and technology companies are facing criticism and possible regulatory oversight regarding the influence they maintain. Many see that the political and cultural clout held by just a few companies may eventually be of concern. (Sources: ECB, IMF, Dept. of Commerce, Bloomberg, http://www.leginfo.legislature.ca.gov, CBO)

 
Equity and Currency Recap

Equities Maintain Their Resilience – U.S. Equity Markets

A persistent trade dispute between the United States and China has been lingering over the financial markets for some time now. Helping to buoy domestic markets are strong corporate earnings and improving economic data. Earnings from U.S. companies this quarter are being considered the healthiest since the third quarter of 2009 during the financial crisis.

Some U.S. companies are seeing an increase in sales as well as an increase in gross margins, considered optimistic by equity analysts. The continued strength of the U.S. dollar, however, is starting to weigh on earnings for certain companies transacting business overseas.

The administration has proposed altering quarterly reporting for publicly traded U.S. companies to a semi-annual basis. Similar proposals have been made by companies and regulators in the past in order to stem volatility and focus on earnings. Recent news has focused on some companies going private and shedding the regulatory hurdles and burden caused by quarterly reporting.

Sources: Bloomberg, Federal Reserve Bank of St. Louis

Emerging Market Currencies Experience Volatility – International Currency Review

Currency valuations across the emerging markets are being affected by recent financial turmoil in Turkey and Argentina. The Turkish currency, the lira, has fallen over 40% year to date versus the U.S. dollar. The Turkish lira has been the hardest hit so far this year of all of the emerging market currencies. Emerging market currencies, as tracked and measured by the MSCI International Emerging Market Index, has had a continuous decline since the beginning of 2018. 

Concerns about the exposure that European banks have to Turkish bonds became a forefront topic for global bankers. Government spending by Turkey has been equal to that of the government in Greece that led to the country’s debt crisis in 2012. Circumstances that occurred in Greece are appearing in Turkey as mounting government debt has hindered the government’s finances and integrity.

The Argentine peso has lost over half its value versus the U.S. dollar so far this year. A sell-off in the Argentine currency was exacerbated when the president of Argentina asked the International Monetary Fund to speed up its release of $50 billion in bailout funds for the country.

Ironically, the economic growth and strength of the U.S. dollar has been a catalyst for emerging market currency turmoil. The problem lies with dollar denominated debt owed by emerging market countries such as Turkey, Greece, Argentina, and Venezuela. As the U.S. dollar appreciates versus the currencies of these other countries, the cost to repay the debt increases. 

Large international banks and institutional holders of emerging market debt buy insurance to protect themselves from default, should countries become unable to pay their debt. The insurance is known as credit default swaps or CDSs. The cost of insuring debt against a default has risen for various countries over the past few months, most notably Lebanon, Turkey, Pakistan, and Argentina. (Sources: Bloomberg, Reuters, FRED, IMF)

 
Fixed Income Update

Yields Continue To Flatten – Fixed Income Update

A flattening Treasury yield curve remained a focal topic among fixed income analysts in August. The shrinking spread, or difference, between the yield on the 2-year Treasury note and the 10-year Treasury bond reached levels not seen since 2007. The interpretation is that longer term economic growth is expected to be muted, which is reflected in the yield of the 10 year Treasury. The Federal Reserve is still on course for additional rate hikes, but at a very gradual pace.

Ten years have passed since the financial crisis that began in September 2008 when the Federal Reserve flooded the financial markets with massive amounts of liquidity in order to stem the crisis at hand. An ultra low interest rate environment followed for nearly a decade before the Fed reversed course and started raising rates once again.

The Federal Reserve mentioned during one of its meetings in August that it had determined when a prolonged period of low volatility exists, an increase in lending and risk-taking ensures.

Sources: U.S. Treasury, Bloomberg


Consumer Debt

Below is a recent article citing the NY Feds latest data on debt:

Households Holding Less Debt – Consumer Behavior

The New York Federal Reserve Bank compiles data on how much debt and what type of debt households have. The most recent release of debt data shows that household debt as a percentage of disposable income fell to the lowest levels since 2002. Debt payments include loans on autos, mortgages, education, and credit card balances.

The data shows that households are seeing less debt payments as a percentage of disposable income. Economists view the recent data from different perspectives. Optimistically consumers may be scaling back on debt payments and thus have more free cash to spend on goods, services, or savings. Pessimistically, consumers may be in the beginning stages of cutting back on borrowing, thus reflecting less confidence in their future income and/or overall financial position.

Either way, holding less debt in a rising interest rate environment is good for consumers since they are saving on the higher costs incurred from rising interest rates. The most recent data shows that households spend about 10.21% of their disposable income on debt payments, a slight decrease from levels over the past two years. (Source: New York Federal Reserve Bank)

This news story while accurate is somewhat misleading. While debt as a percentage of disposable income has slightly declined, total consumer debt sits at a record setting $13.3 trillion. Total household debt is now nearly 20% above the post-financial trough reached during the second quarter of 2013. Breaking it down mortgage debt is now $9 trillion, credit card debt is $829 billion, auto debt is $1.24 trillion and student loan debt sits at a record high of $1.41 trillion.

So while debt as a percentage of income may have fallen slightly overall debt has reached record breaking levels. Clearly historically low unemployment has meant that the “average” household has more disposable income and can currently service their massive debt levels. You don’t need to be a math genius to understand that even a slight increase in unemployment could send this bubble bursting quickly.

 
Credit Spreads & Yield Curve

Credit spreads have remained stable since August with IG spreads sitting in a basis point range between 115-120. High yield spreads have dropped from 349bps on September 6th to 324bps on September 18th. That is a pretty large move in a 2 week period and now puts the difference between high yield and IG at 209 basis points. Regular readers will know that we have written about this spread differential extensively by looking at the chart below you can see that at 209bps we are now below the record low spread reached in 2005 of 212 basis points.


This should be a major warning sign to fixed income investors especially those holding debt that is either barely investment grade or already junk rated. A reversion to the mean would mean a shift of over 300 basis points which translates to a dollar price drop of almost 25 points (or 25%) on a 10 year bond. History has shown however that when spreads widen they don’t generally revert to the mean but after these long grinding moves tighter they tend to overshoot the average significantly. The spread differential moved 340bps from Jan 2000 to Dec 2000, 1300bps from Feb 2005 to Dec 2008 (credit crisis), and over 400bps from June 2014 to Feb 2016. This could translate into major pain and losses in excess of 50% for junk bond holders.

Meanwhile, after moving from over 30bps to under 20bps in August, the 10’s to 2’s curve has moved slightly higher and now sits at 26bps. In the overall scheme of things this is insignificant as the overall trend is still tighter and we expect the curve to invert sometime before the end of the first quarter of 2019. As we have discussed, historically this has signaled an economic slowdown in the near future. There is a lot of debate about how and why this time is different. Certainly central bank interference and monetary policy are playing a major role but we believe that this will only serve to ultimately cause the unwinding to be far more severe and painful.

 
TSLA Update

While credit spreads have remained tight and overall high yield has done very well, Tesla bondholders have not faired so well. As the chart below shows it has been a wild ride for the TSLA 5.3% of 8/15/25 and our prediction of dramatic price declines in the bonds has been spot on.

After being issued at $100 in August of 2017, these bonds tumbled to a new low near $83 in September and we believe investors should view the 3 point recovery as a gift. It should be clear to readers that we do not view these bonds favorably. We have written extensively about these bonds and believe that risk-averse investors should avoid these bonds at all cost.

A friend of mine recently purchased the new Tesla Model 3 and took me for a test drive. I must admit that it is an awesome machine and a technological marvel. The acceleration was astounding, I would say it “felt” faster than the 2012 Porsche 911 Turbo I owned. And while in my opinion the interior left something to be desired for a car at that price point, overall I was impressed. Unfortunately, that may not be enough to save this company. They will almost certainly need to raise additional cash very soon which could very well come at the expense of existing covenant lite bondholders.  The competition is about to become fierce as major luxury brands are about to flood the market with their own electric cars. And of course,  Mr. Musk acts more like a dope smoking teen you might find Dr. Phil admonishing than the CEO of a major corporation.

 
Summary & Strategy

Summary

Stocks continue to make new highs, bond yields are rising, the yield curve is flattening and credit spreads are at extremely tight levels.  The massive amount of global debt means that at some point the debt service will become unmanageable.  The reality is that under every economic principle our current utopian investors environment should not be possible.   Historically low unemployment should mean rapid wage growth and inflation.  Record debt levels should mean wider spreads.  A decade of low interest rates and printing an unfathomable amount of money should mean inflation.  I could go on and on about our perverted economic system and If you watch CNBC you will find there is no shortage of cheerleading economic experts standing by daily to explain why this time is different.  I suppose it is possible that this time is different and we have entered a new paradigm and all economic law as we know will be re-written.  The Dow could run to 50,000 as we hit a quarter of a quadrillion in global debt and run it up to a half quadrillion.  It is your call folks, swim at your own risk.

Strategy

We continue to believe that income investors should remain or rebalance into short maturity (1-3 years) high quality bonds.  With the yield curve and credit spreads historically low and tight, investors are not rewarded for taking risk.  Remember, the longer the bond the more price volatility and at current spreads there is no reason to own long bonds.  It is still possible for knowledgeable investors to earn 5%+ in short duration high quality asset-backed securities.  We still like the yield curve steepening trade we discussed in the special report available on our website.  The bonds have (as we correctly called) found a floor now that for the most part the coupons have hit zero.  As the weak sellers have exited the bonds seem to have stabilized and have actually moved up slightly since we issued our report.


Seminars

On another note we began our first of several free educational seminars which covered “Understanding Mortgage-Backed Securities”.  We plan to host these twice a month depending on interest and will be covering a wide range of fixed income investment topics from basic to advanced (October 10th we are covering CMO structure).  These are free, true  no pressure educational seminars – attendees will not be cold called or followed up with in any manner. If you are interested please email us and let us know what topic you would be interested in and if comfortable your level of fixed income investment experience so we can try and match you with the right seminar.


No pic this month but I will still offer up our favorite adage – “PIGS GET FAT AND HOGS GET SLAUGHTERED”

Happy Investing

David Dellinger