Fortis Wealth Management

(888) 336-7847

www.investfortis.com

September 2019
Market Update
(all values as of 08.31.2023)

Stock Indices:

Dow Jones 34,721
S&P 500 4,507
Nasdaq 14,034

Bond Sector Yields:

2 Yr Treasury 4.85%
10 Yr Treasury 4.09%
10 Yr Municipal 2.87%
High Yield 8.27%

YTD Market Returns:

Dow Jones 4.75%
S&P 500 17.40%
Nasdaq 34.09%
MSCI-EAFE 8.50%
MSCI-Europe 9.83%
MSCI-Pacific 6.17%
MSCI-Emg Mkt 2.50%
 
US Agg Bond 1.37%
US Corp Bond 2.76%
US Gov’t Bond 1.53%

Commodity Prices:

Gold 1,966
Silver 24.82
Oil (WTI) 83.60

Currencies:

Dollar / Euro 1.08
Dollar / Pound 1.26
Yen / Dollar 146.14
Canadian /Dollar 0.73
 

Macro Overview

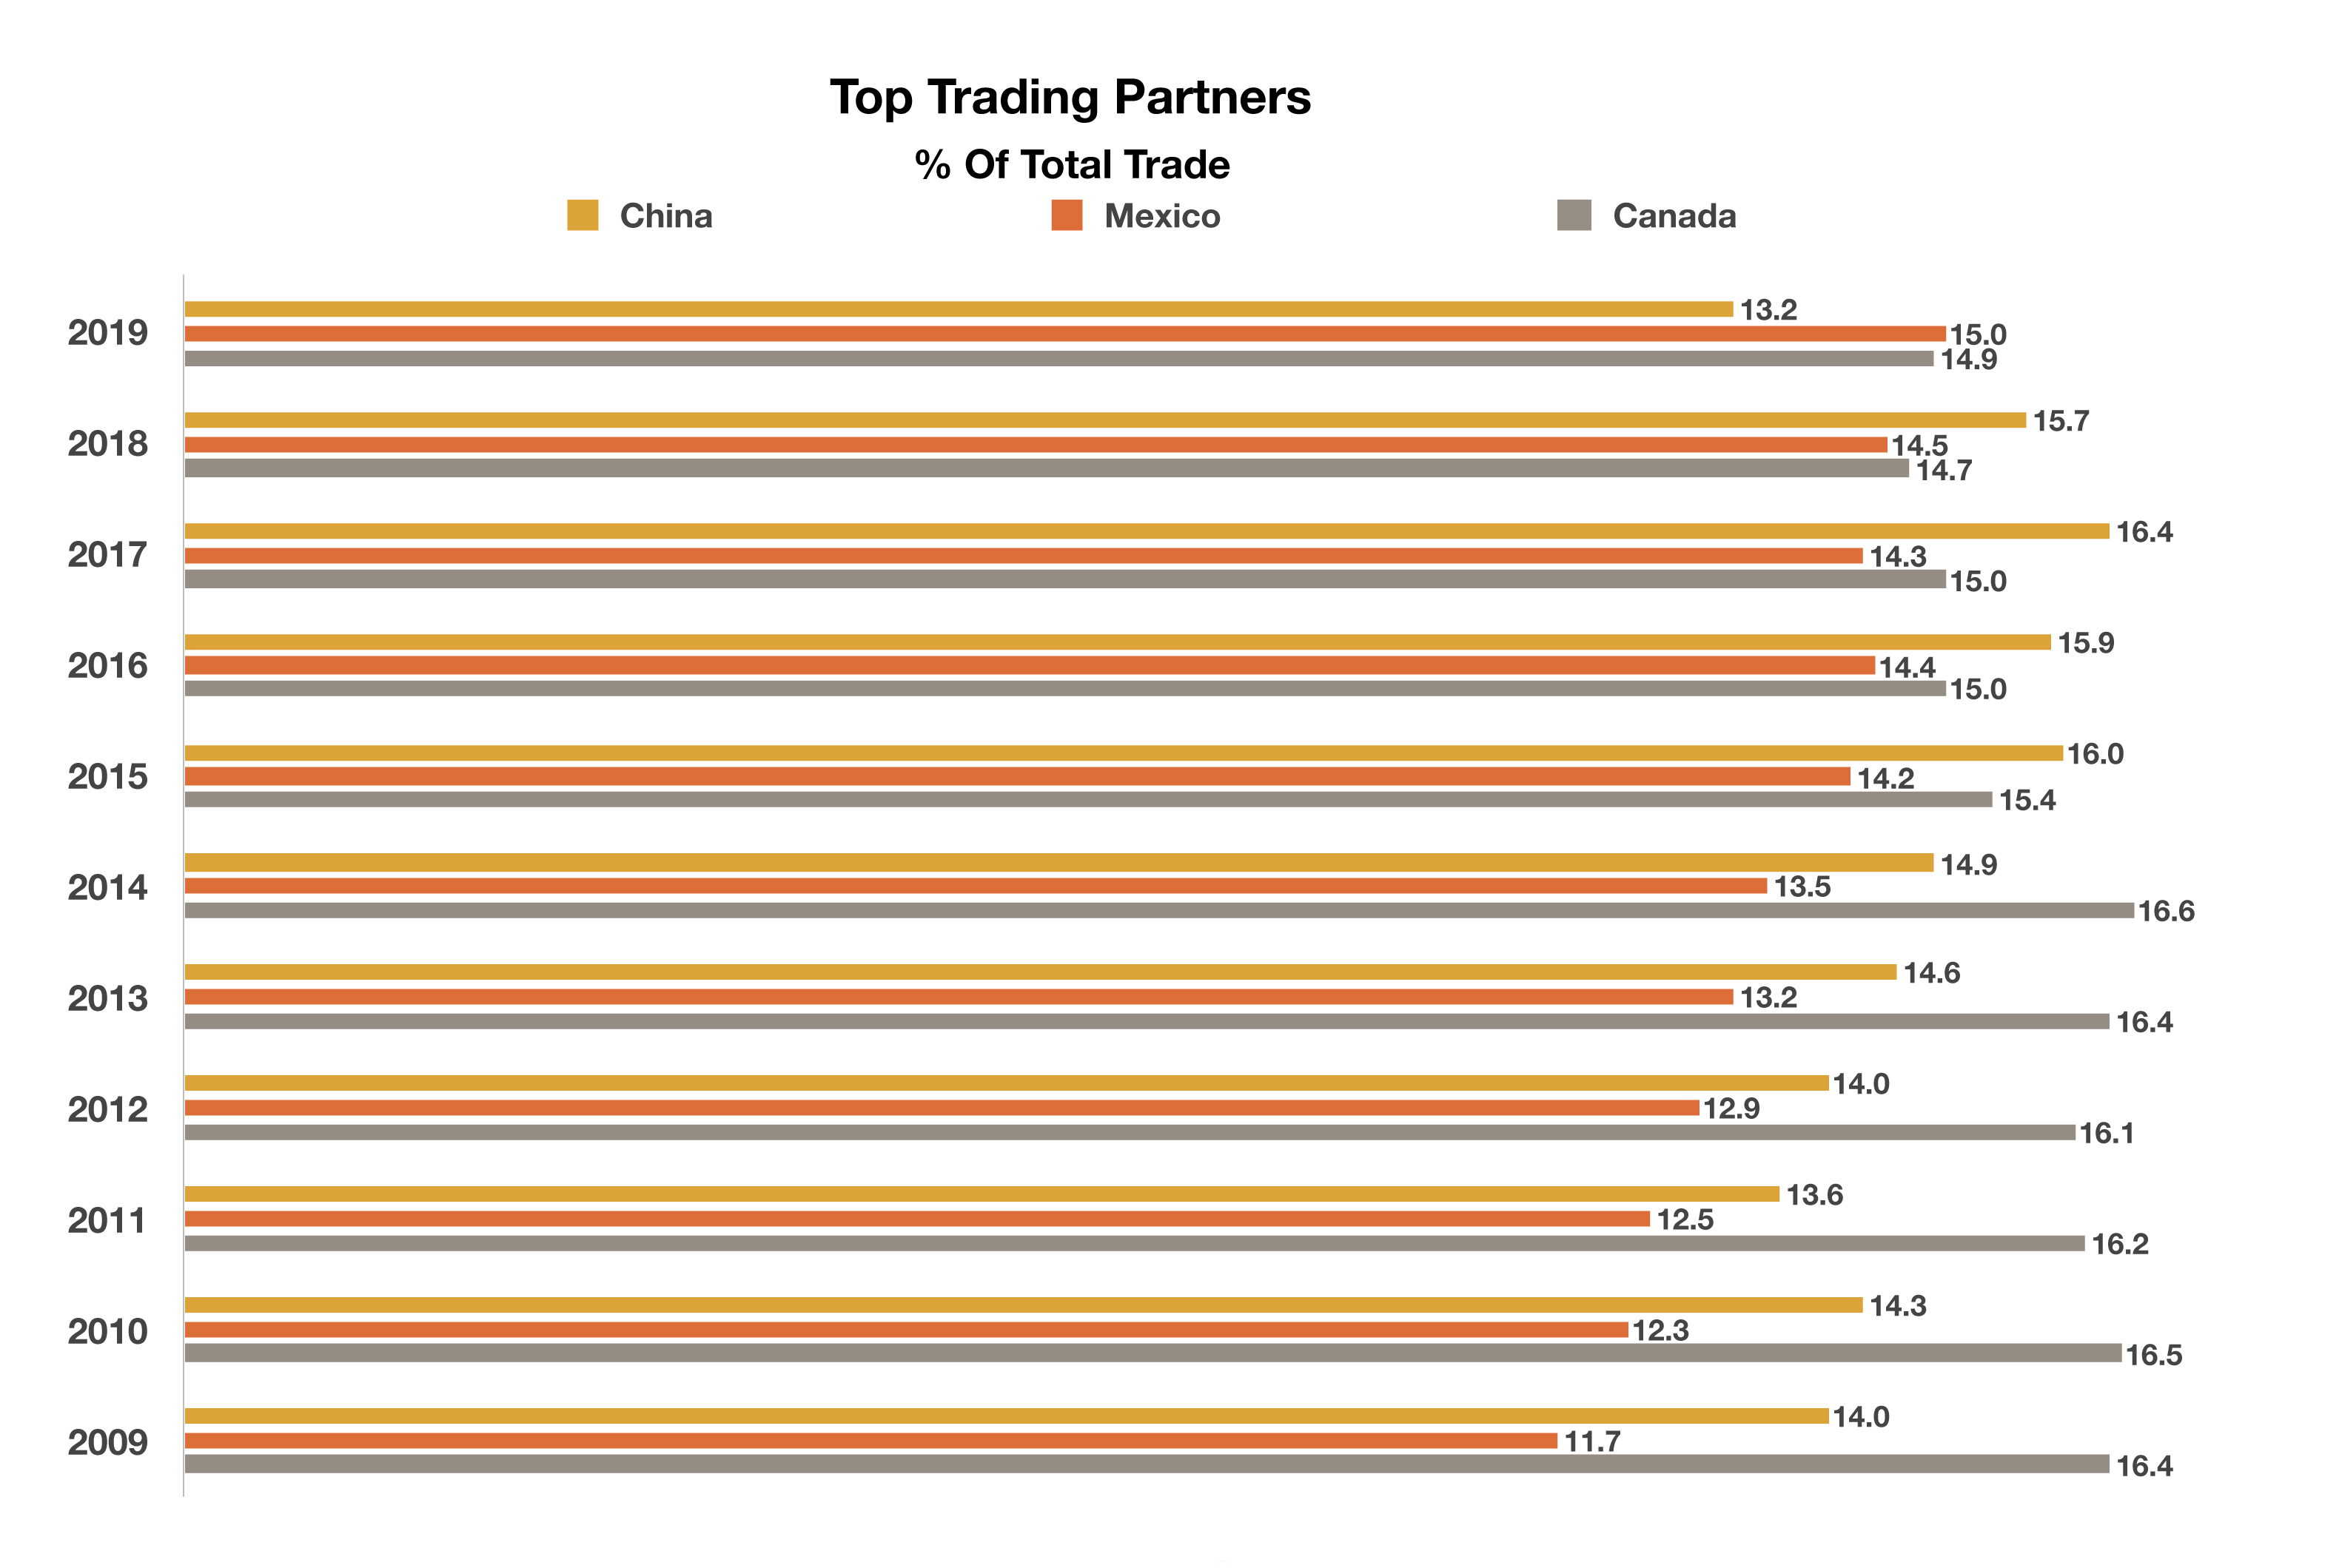
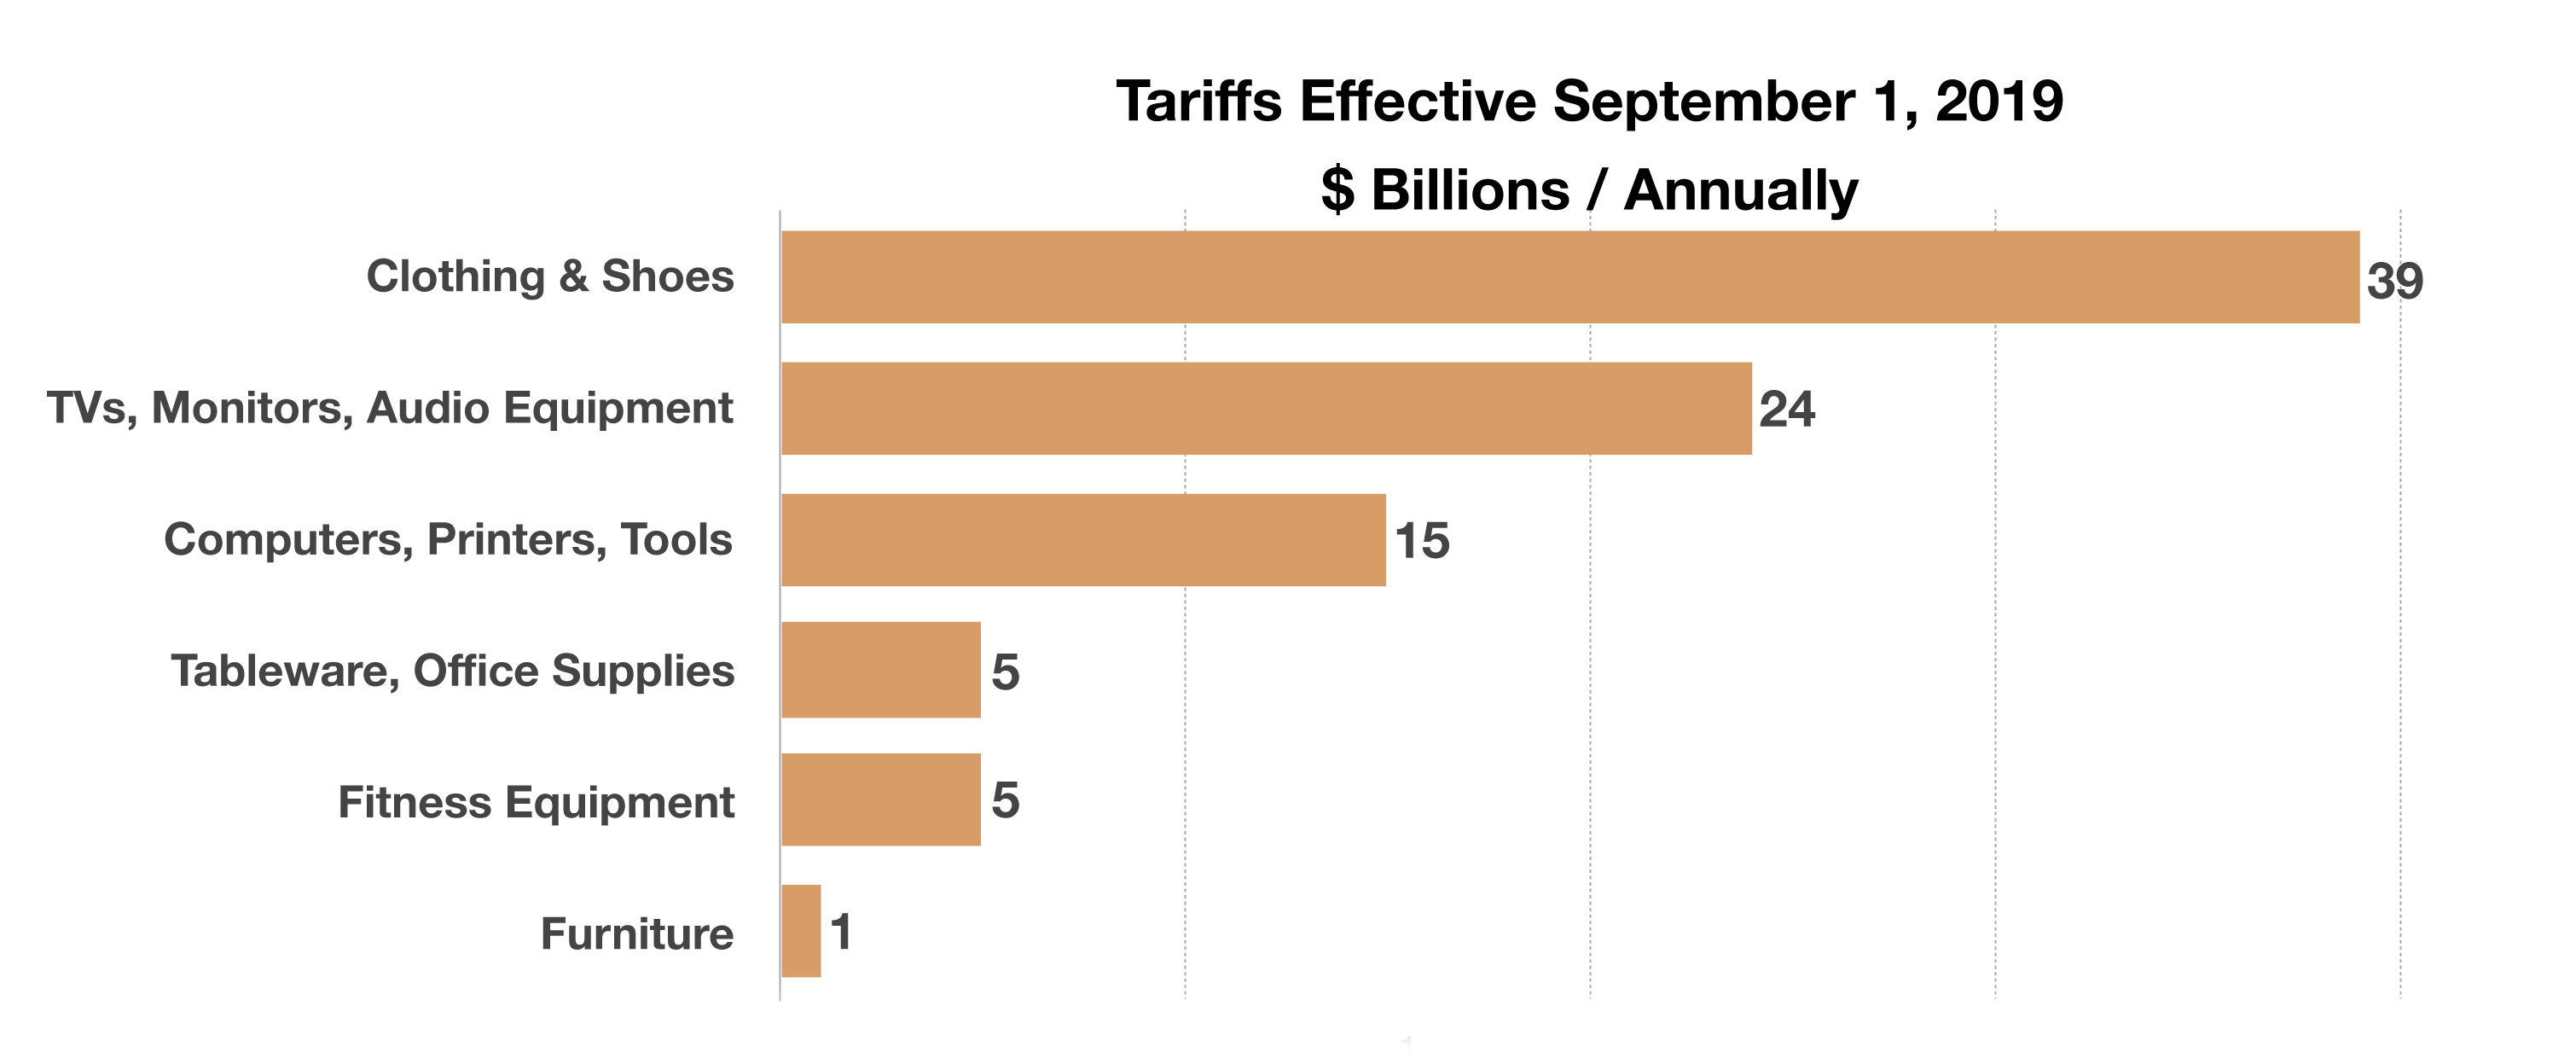
A 15% tariff was imposed on roughly 40% of consumer products imported to the U.S. from China effective September 1st, affecting over $100 billion worth of annual imports. An additional slew of products from China is scheduled to be assessed a 15% tariff on December 15th, applicable to nearly everything imported from China by year end.

The announcement of additional tariffs on Chinese imports into the U.S. prolongs uncertainty surrounding the extent of the ongoing trade tensions. Since tariffs are dictated by trade policy, some economists believe that a potential delay or reversal of a portion of the scheduled tariffs is possible.

China has allowed its currency, the yuan, to fall in response to the U.S. decision to apply additional tariffs, weakening the Chinese currency on a relative basis and making Chinese exports more competitive internationally. In response, the U.S. Treasury Department designated China as a currency manipulator in early August, a designation that addresses potential unfair trade practices. China’s currency fell 3.7% against the U.S. dollar in August, the single largest monthly drop in 25 years.

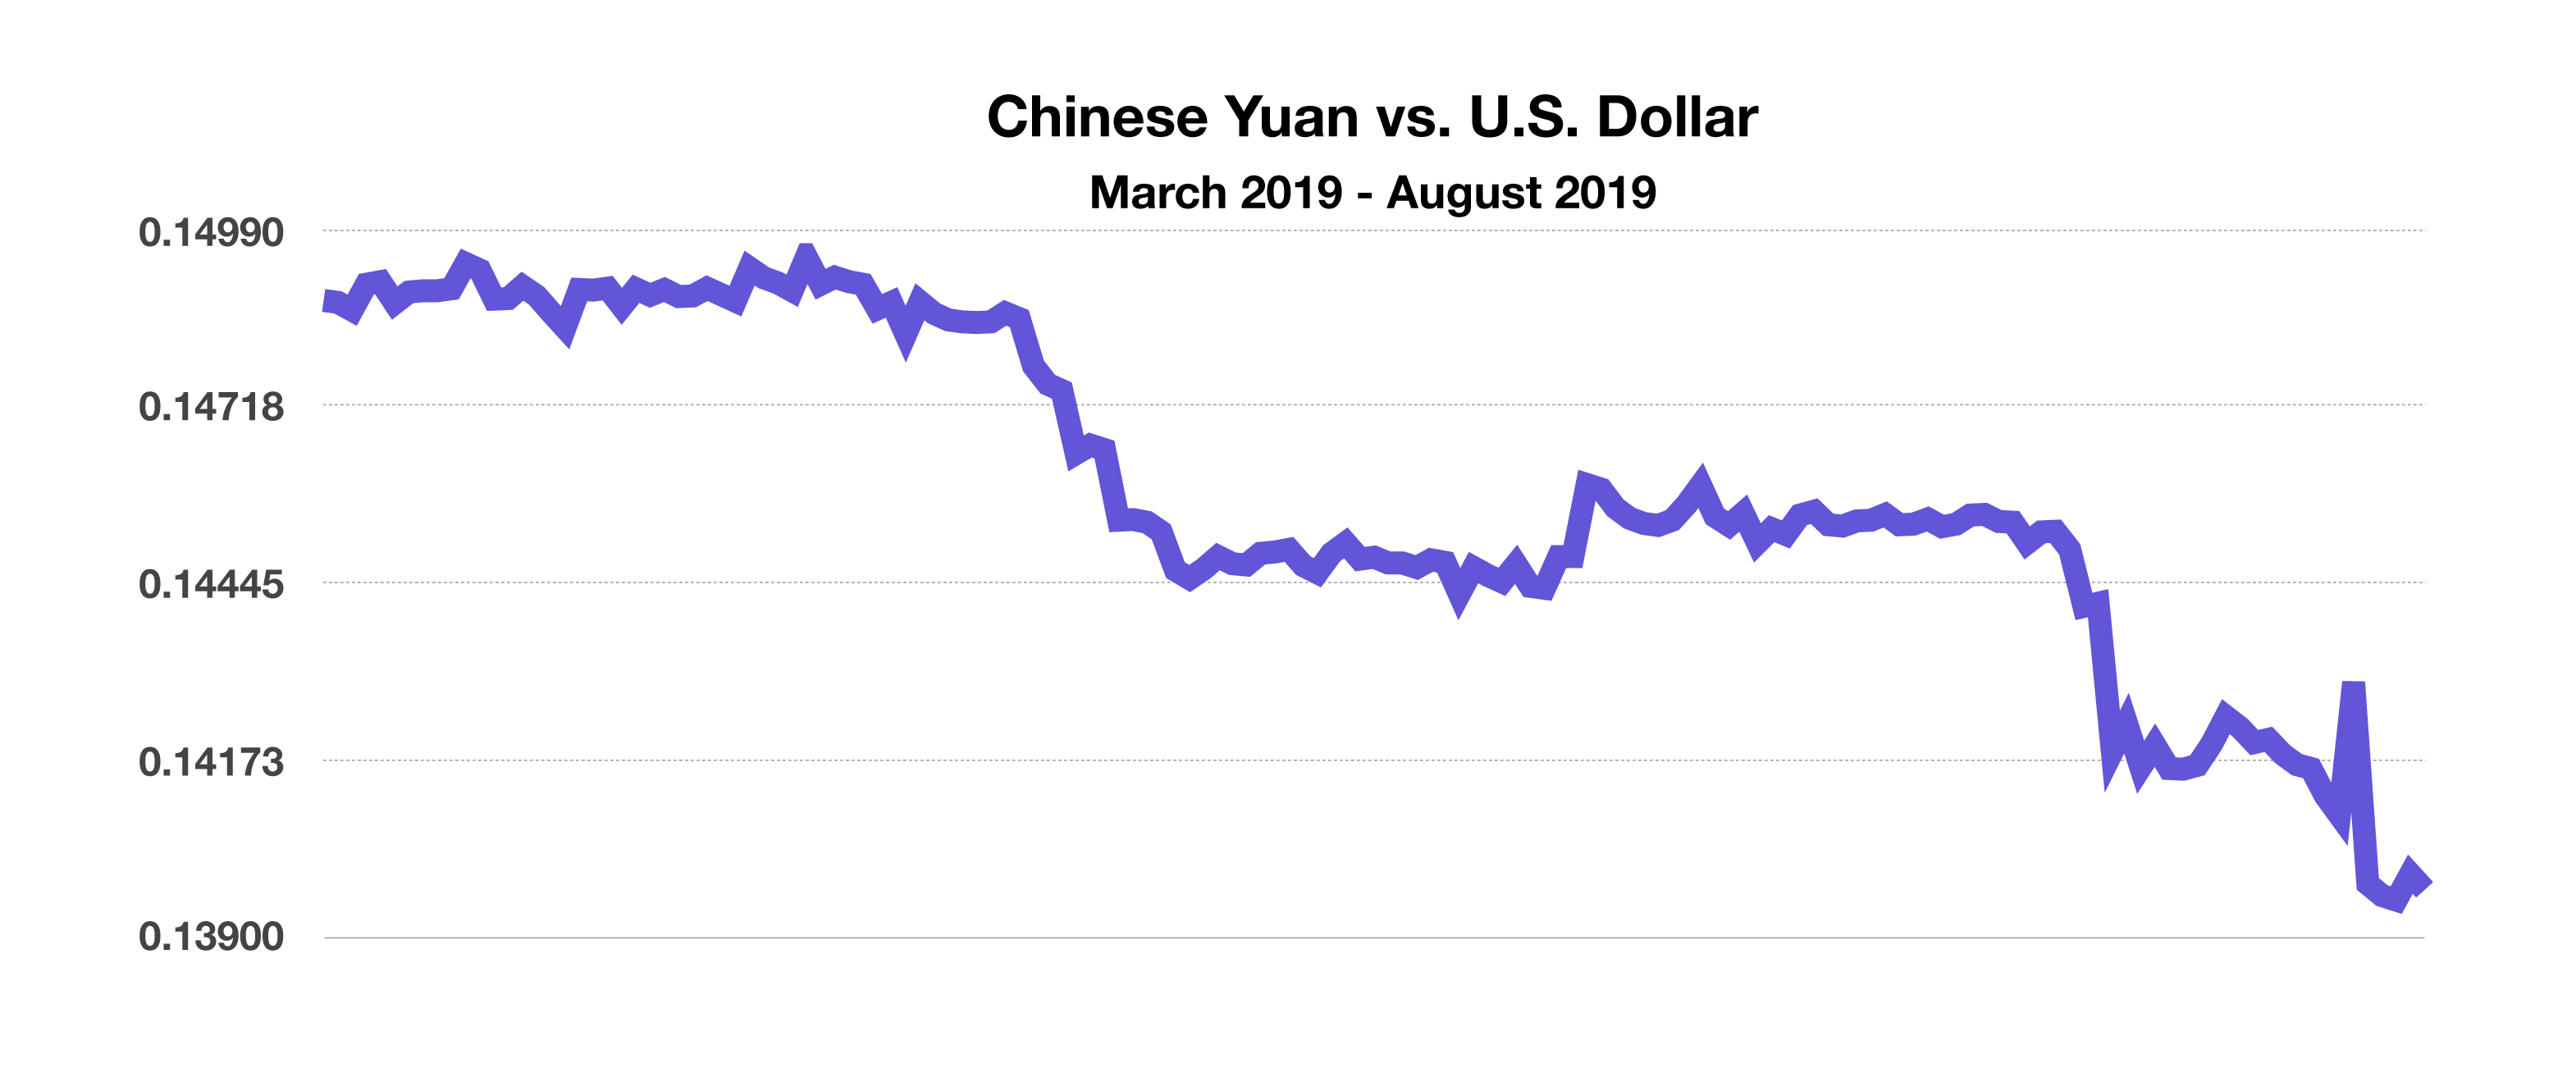
The Congressional Budget Office (CBO) estimates that the U.S. budget deficit will surpass $1 trillion in 2020 and continue to expand to over $1.3 trillion by 2029. The ten-year projection is based on increasing tax revenue but slower future GDP growth of 1.8% per year.

Stocks have been resilient since the beginning of the year despite ongoing tariff threats, a slowing global economy, softening earnings projections, and uncertainty surrounding international debt levels. All eleven sectors of the S&P 500 Index were still positive year-to-date as of the end of August.

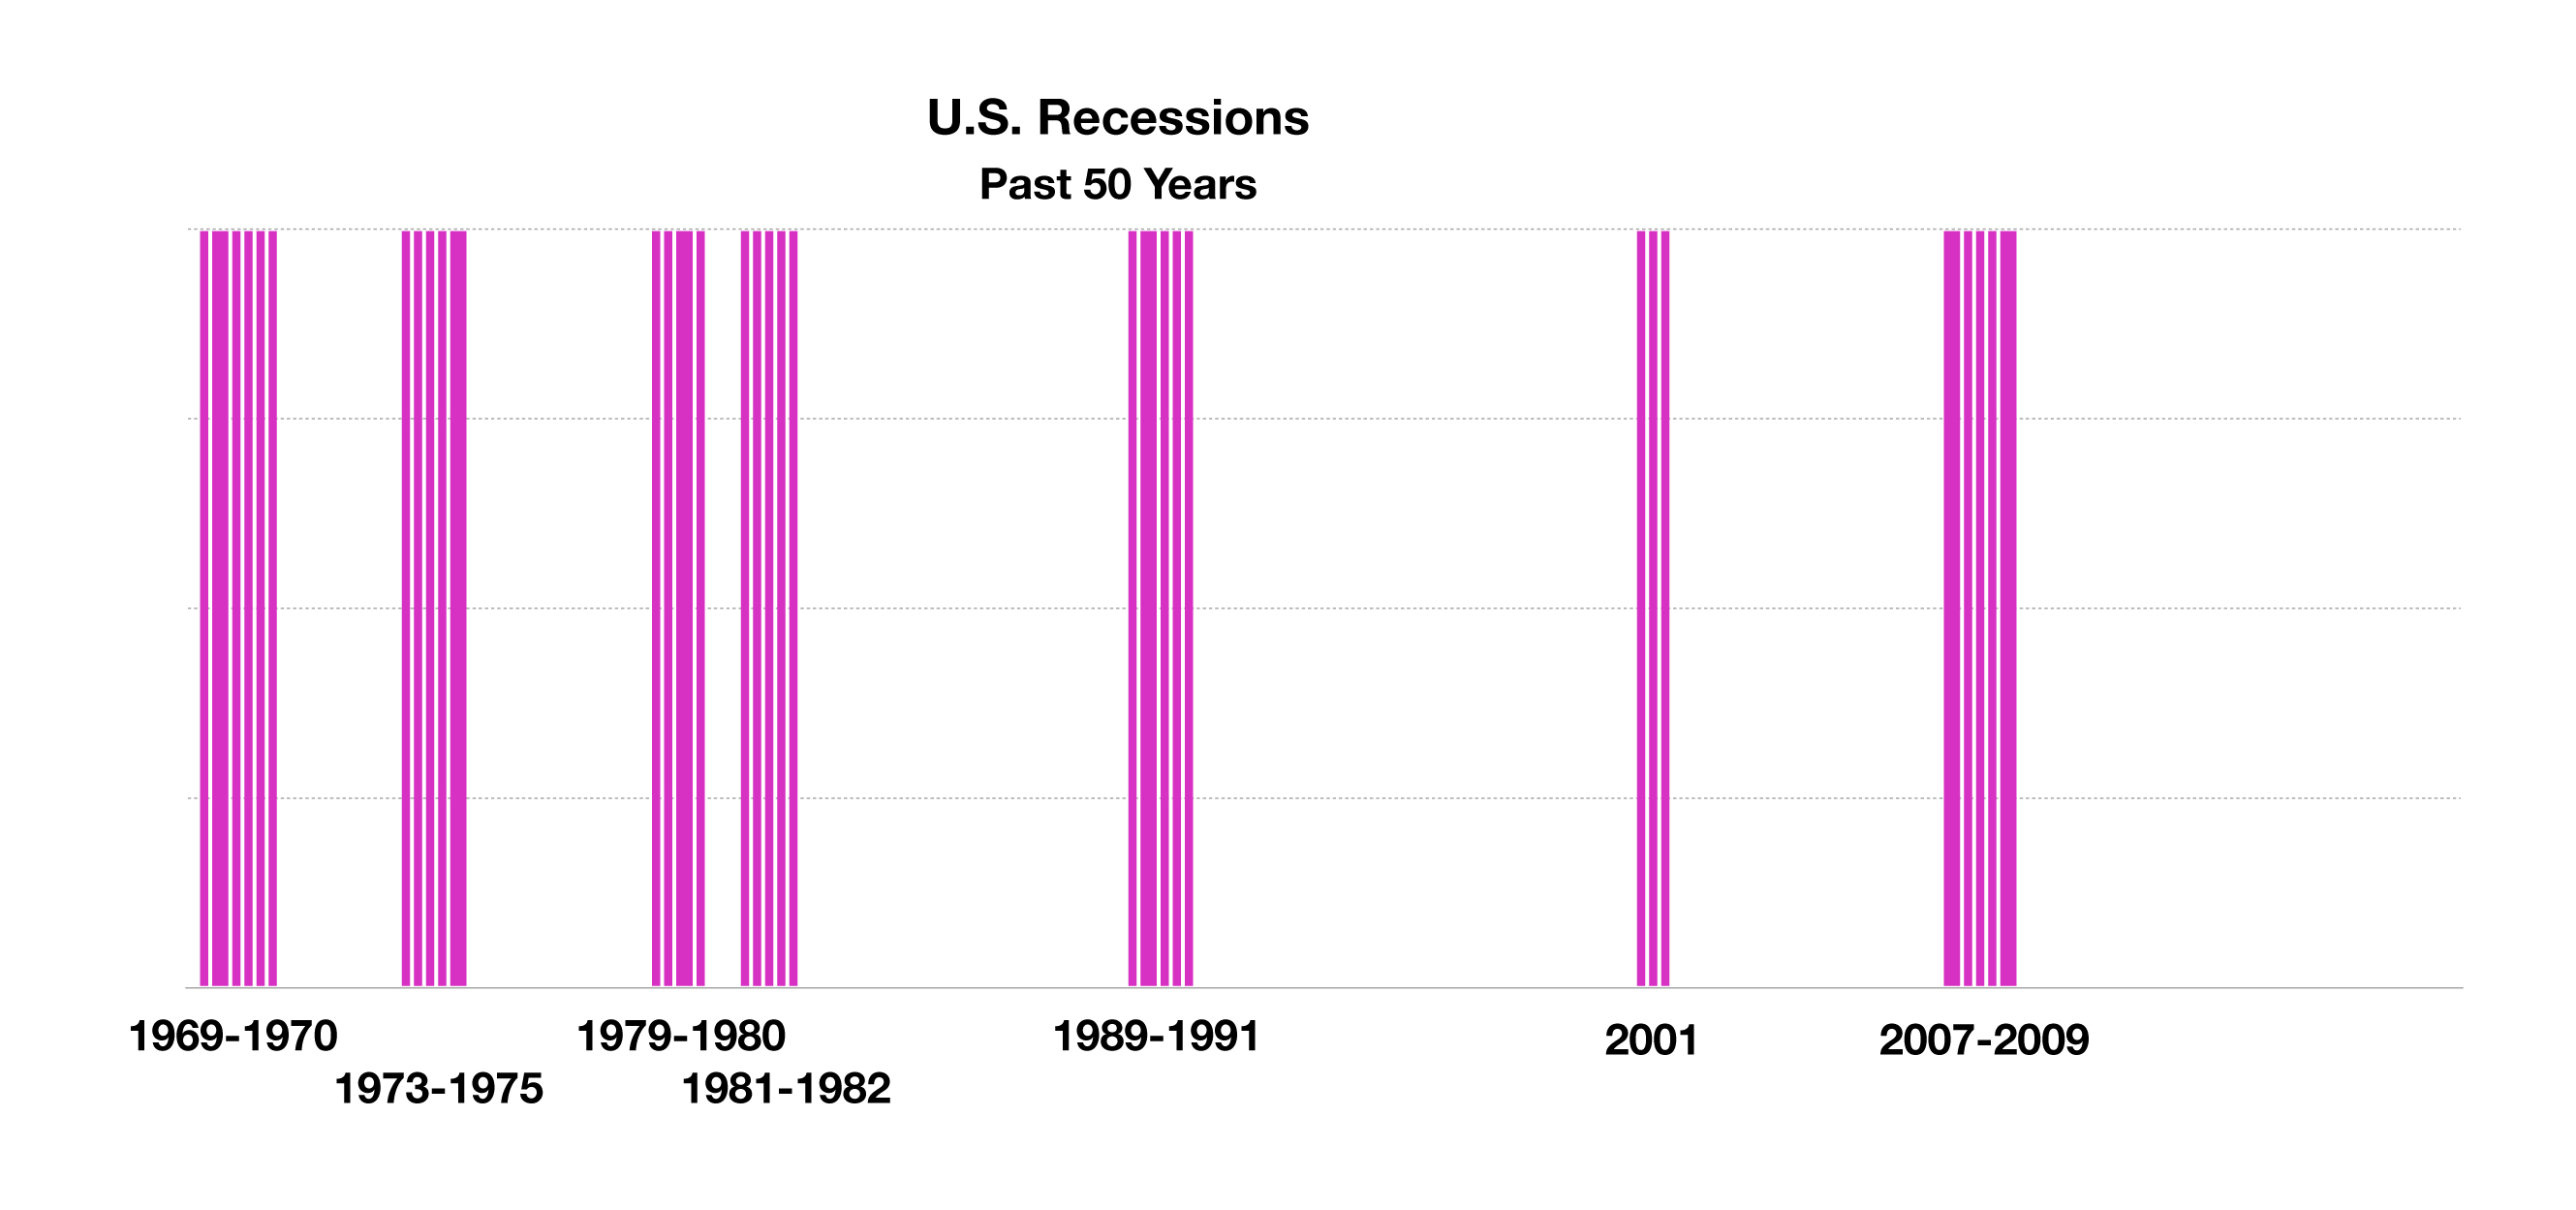
Recession fears fueled volatility and uncertainty as bond yields continued to fall in August. Economists view higher short-term rates relative to long-term rates, also known as an inverted yield curve, as a signal of slowing economic growth. Any validation of an upcoming recession is subjective, with expectations varying from economist to economist.

Global yields continued their decline in August, with 30-year German government bond yields falling below 0% while the 30-year U.S. Treasury bond yield dipped below 2% for the first time on record. Roughly $16 trillion worth of global bonds now carry negative yields, of historical significance in the fixed income markets.

Argentina is close to defaulting on its government debt, owing approximately $50 billion of long-term debt primarily held by foreign investors. Argentina’s currency, the peso, fell 25% against the U.S. dollar in August, the steepest drop since its last currency crisis. (Sources: Commerce Dept., U.S. Treasury, Federal Reserve, CBO, Bloomberg, S&P)

 
The yield on the 30-year Treasury bond fell below 2% for the first time

Volatile Month For Stocks – Equity Overview

Despite the volatility in August, all eleven sectors of the S&P 500 were still positive year-to-date as of Aug 30th, with the technology, real estate, and consumer discretionary sectors leading.

Earnings moved to the forefront of concerns for equities as the effect of Fed rate cuts dissipated with fewer future cuts expected. Global growth headwinds along with international debt issues contributed to market uncertainty.

Equity analysts are following three primary market risks influencing U.S. stock prices: effects of trade tensions; slide in earnings estimates; and fewer Fed rate cuts than previously anticipated. (Sources: S&P, Bloomberg)

Bond Yields Continue To Decline – Fixed Income Update

Bond prices continued to rise in August, causing bond yields across most sectors to fall. The bond market has been the primary indicator of recessionary threats for decades, when short-term bond yields rise above longer term bond yields. Long-term bonds have been among one of the best performing asset classes year-to-date alongside equities, a pairing that is an anomaly in financial markets.

The yield on the 10-year Treasury bond fell to 1.50% in August, its largest monthly yield drop since 2011. The yield on the 30-year Treasury bond fell below 2% in August, fueling expectations of dismal economic long-term growth.

The U.S. Treasury is considering the first-ever issuance of 100-year U.S. Treasury bonds in order to take advantage of the current ultra-low rate environment. Other countries have already used long-dated debt to take advantage of the global low-rate environment, with Austria, Belgium, and Ireland issuing century bonds over the past few years. (Sources: Treasury Department, Eurostat, Bloomberg)

What The New Tariffs Will Affect – Trade Policy Review

Although tariffs are assessed on a wholesale level, most manufacturers are passing along new tariffs to consumers in the form of higher prices. Unlike prior tariffs applied to Chinese imports earlier in the year on unfinished materials and products, such as aluminum and components used for manufacturing purposes, the tariffs effective Sept 1st will impact mostly finished consumer products.

The tariffs will apply to products from clothing and shoes to furniture and computers. Sneakers, sweaters, pants, dresses, and baby clothes all fall under a category worth roughly $39 billion in annual imports from China. Higher priced items such as furniture products including chairs and sofas are worth roughly $1 billion in annual imports.

The new tariffs may not result in immediate price hikes at stores, as some retailers have stockpiled inventories of products with no assessed tariffs because they were imported before September 1st. (Sources: U.S. Department of Commerce)


Yields for 10-year bonds in Germany and Japan yielded -0.69% and -0.27%

U.S. Recessions – Historical Note

Historians and economists identify 47 recessions in the United States dating back to the Articles of Confederation, which was ratified in 1781. The duration and intensity of each recession has been unique, with various factors affecting economic conditions contingent on current circumstances.

Interestingly, the recession during the early 80s from 1980 through 1982 was driven by inflation and rising interest rates which created an expensive and restrictive environment for consumers and businesses. Conversely, economists currently view any probable recession as being driven by an ultra-low-rate environment and minimal inflation, believed to be a result of excessive stimulus created by the Federal Reserve and dismal economic growth projections.

Modern recessions occurring in the 19th century have resulted from financial crises and market-driven events, while recessions that occurred in the 1800s were primarily driven by war and the weather due to economic dependence on agriculture.

Low interest rates and weakening economic indicators support an argument for a recessionary environment. Economists and analysts view recessions as a component of an economic cycle driven by expansions and contractions. (Source: Federal Reserve; fred.stlouisfed.org/series/JHDUSRGDPBR)

U.S. Treasuries Remain Attractive – Global Fixed Income Overview

Even as the 10-year Treasury yield fell below 1.5% in August, it is still offering a much more attractive yield than most other developed country government bonds. Yields for 10-year government bonds in Germany and Japan yielded -0.69% and -0.27%, respectively. Such negative yields mean that investors are basically paying the governments of Germany and Japan to hold onto their funds. International investors not only pursue the best yields possible, they also seek the safest debt for any given yield. The U.S. continues to offer the most transparent and liquid debt worldwide of any country or company. U.S. Treasury bonds are also held for trading purposes and for currency control. If too many bonds are bought, then lower rates may weaken the currency, a trade strategy utilized by countries to stabilize or alter exports. 
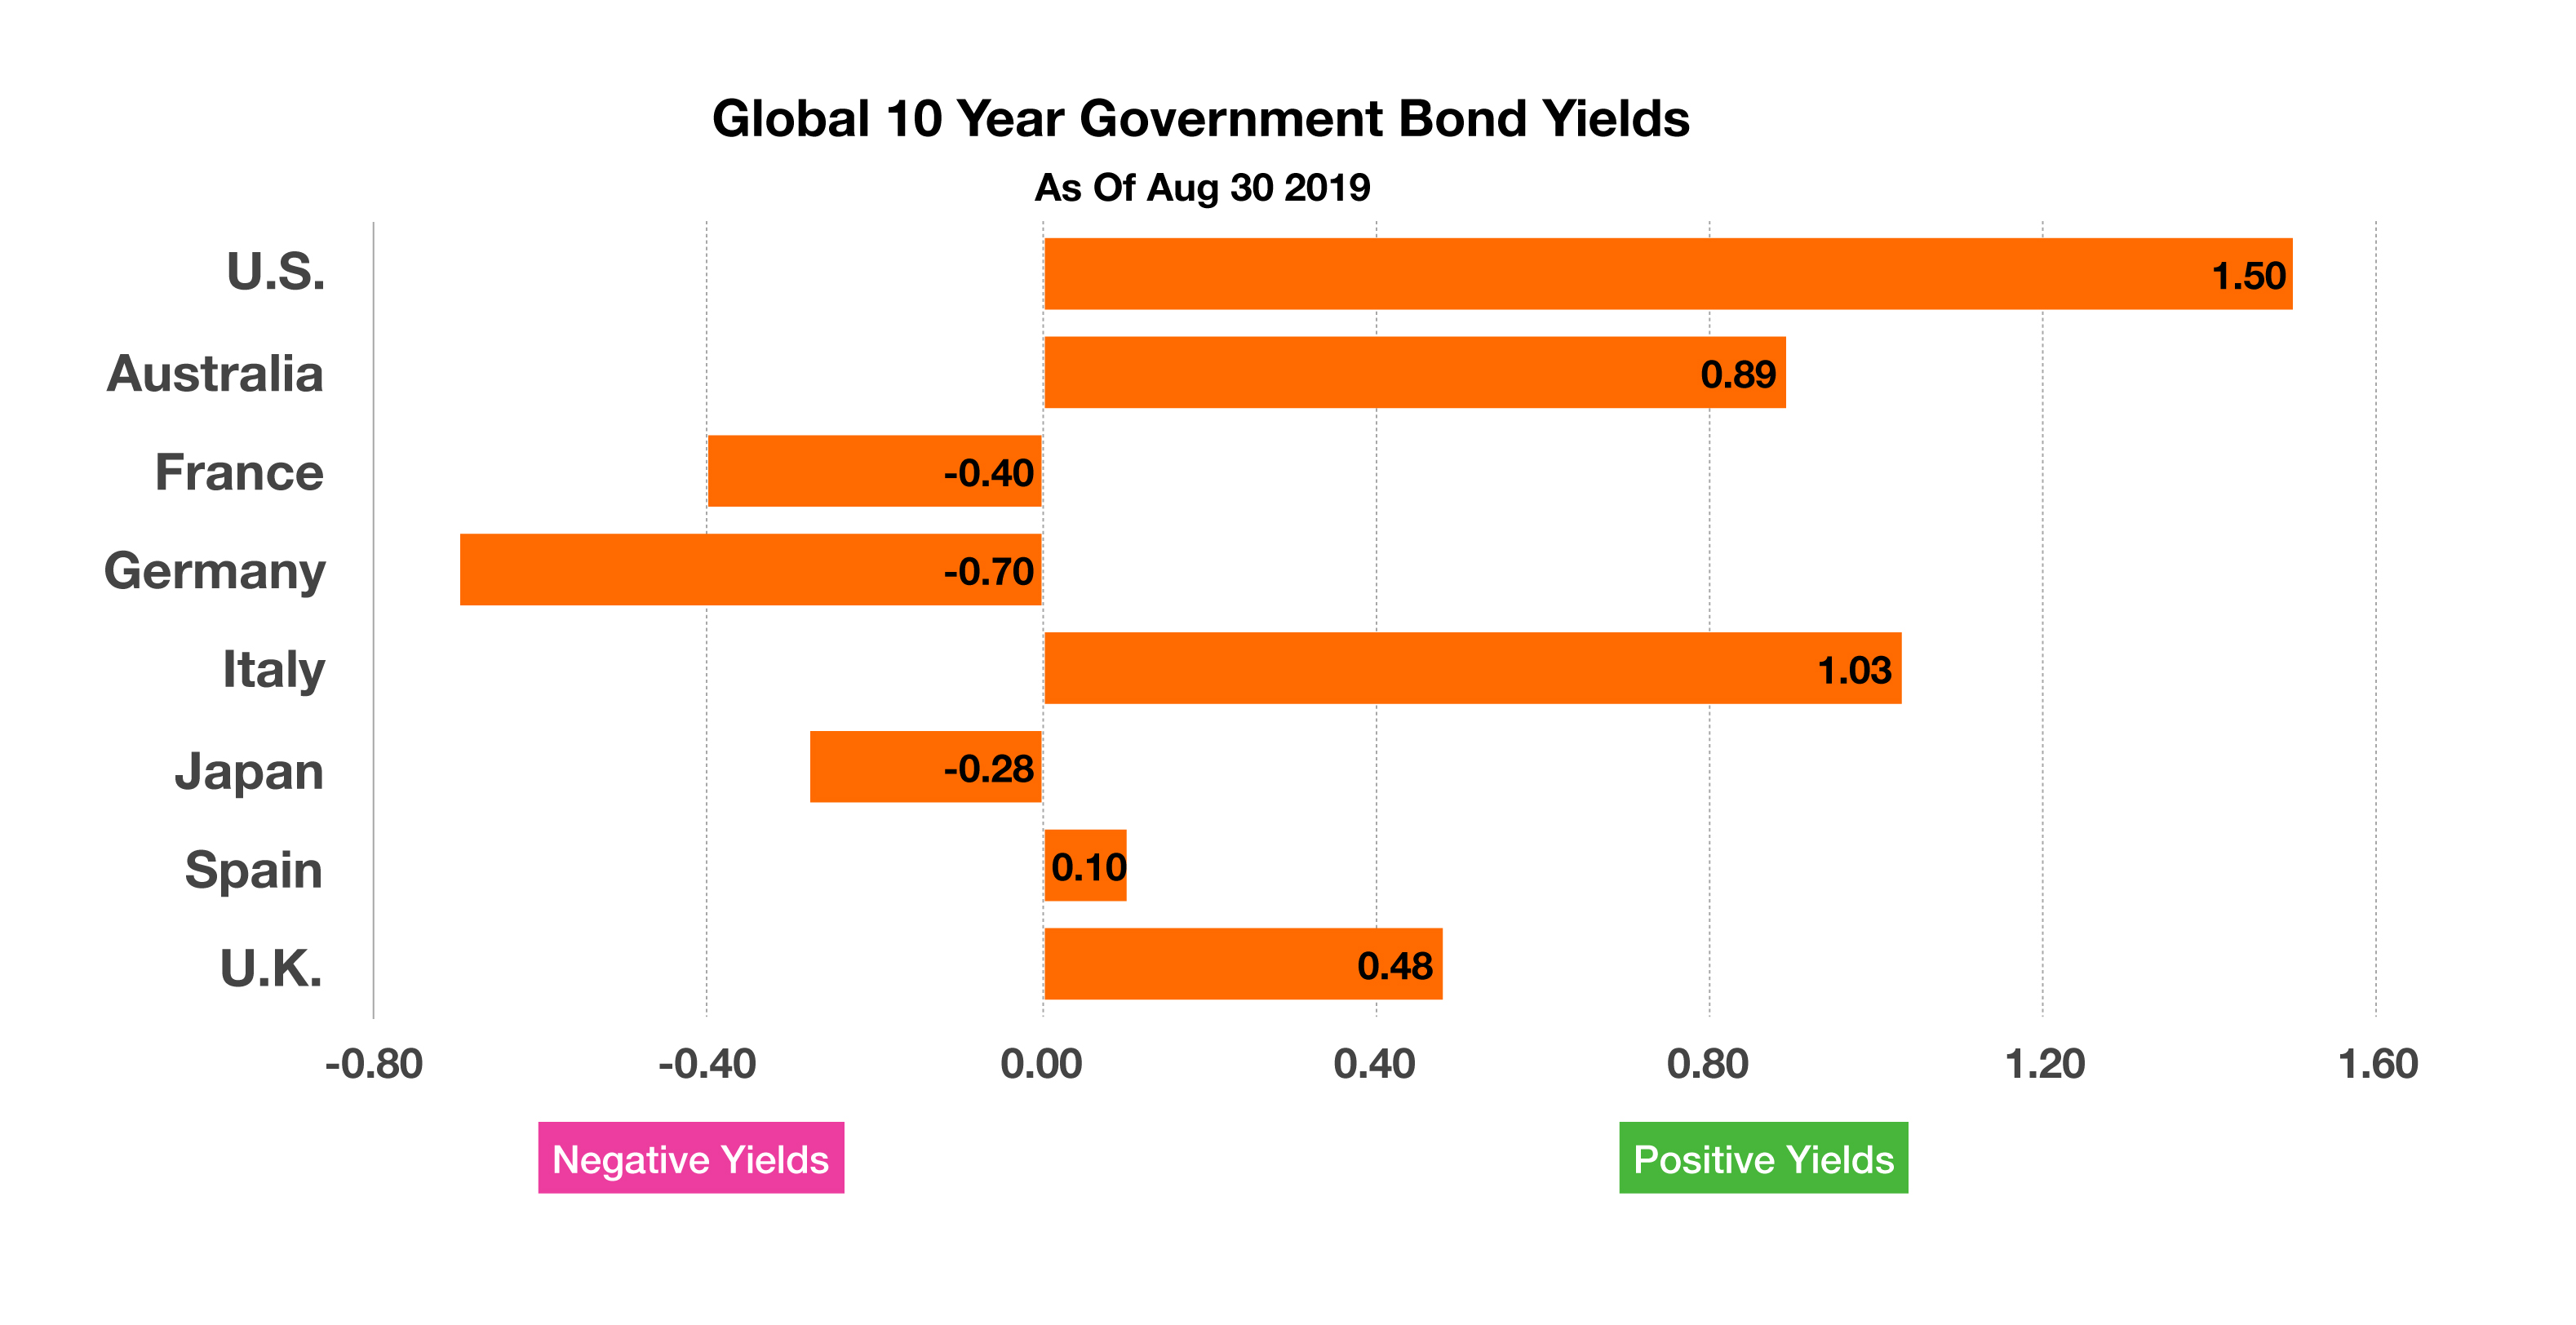
Developed countries whose 10-year government bond yields were below 0% as of the end of August include France, Germany and Japan. (Sources: Bloomberg, U.S. Treasury)

 
China represents 13.2% of total trade activity with the U.S.

China No Longer Largest Trade Partner With U.S. – International Trade

The United States maintains a favorable trading relationship with many countries all over the world, yet only a handful encompass the bulk of all trading activity. For years, Mexico, China, and Canada have been the top three trading partners with the United States, with imports and exports across borders comprised of all types of products and materials.

Trade treaties with Mexico and Canada have facilitated trade with the U.S. for years, while recently-imposed tariffs on Chinese imports have reduced trade volumes with China and diverted activity to Canada and Mexico. Since the imposition of new tariffs, some manufacturers and suppliers have shifted their operations to Canada and Mexico in hopes of averting increasing costs and tightening margins.

Trade data released this past month have validated the effects of the newly imposed tariffs, with China no longer the top trading parter with the United States. Mexico and Canada are now the top trading partner countries, with China third ahead of Japan. Of note, Mexico and Canada have been top trading partners ahead of China before, with Canada the top trading partner through the 2000s up to 2014. Ten years ago in 2009, China represented 14% of total trading activity with the U.S., reaching 16.4% of all trading in 2017. The latest trade data shows China now representing 13.2% of total trade activity, with Mexico and Canada each accounting for roughly 15% of total trade.

Source: U.S. Commerce Dept., Census.gov