Dow Jones | 34,721 |
S&P 500 | 4,507 |
Nasdaq | 14,034 |
2 Yr Treasury | 4.85% |
10 Yr Treasury | 4.09% |
10 Yr Municipal | 2.87% |
High Yield | 8.27% |
Dow Jones | 4.75% |
S&P 500 | 17.40% |
Nasdaq | 34.09% |
MSCI-EAFE | 8.50% |
MSCI-Europe | 9.83% |
MSCI-Pacific | 6.17% |
MSCI-Emg Mkt | 2.50% |
US Agg Bond | 1.37% |
US Corp Bond | 2.76% |
US Gov’t Bond | 1.53% |
Gold | 1,966 |
Silver | 24.82 |
Oil (WTI) | 83.60 |
Dollar / Euro | 1.08 |
Dollar / Pound | 1.26 |
Yen / Dollar | 146.14 |
Canadian /Dollar | 0.73 |
Macro Overview
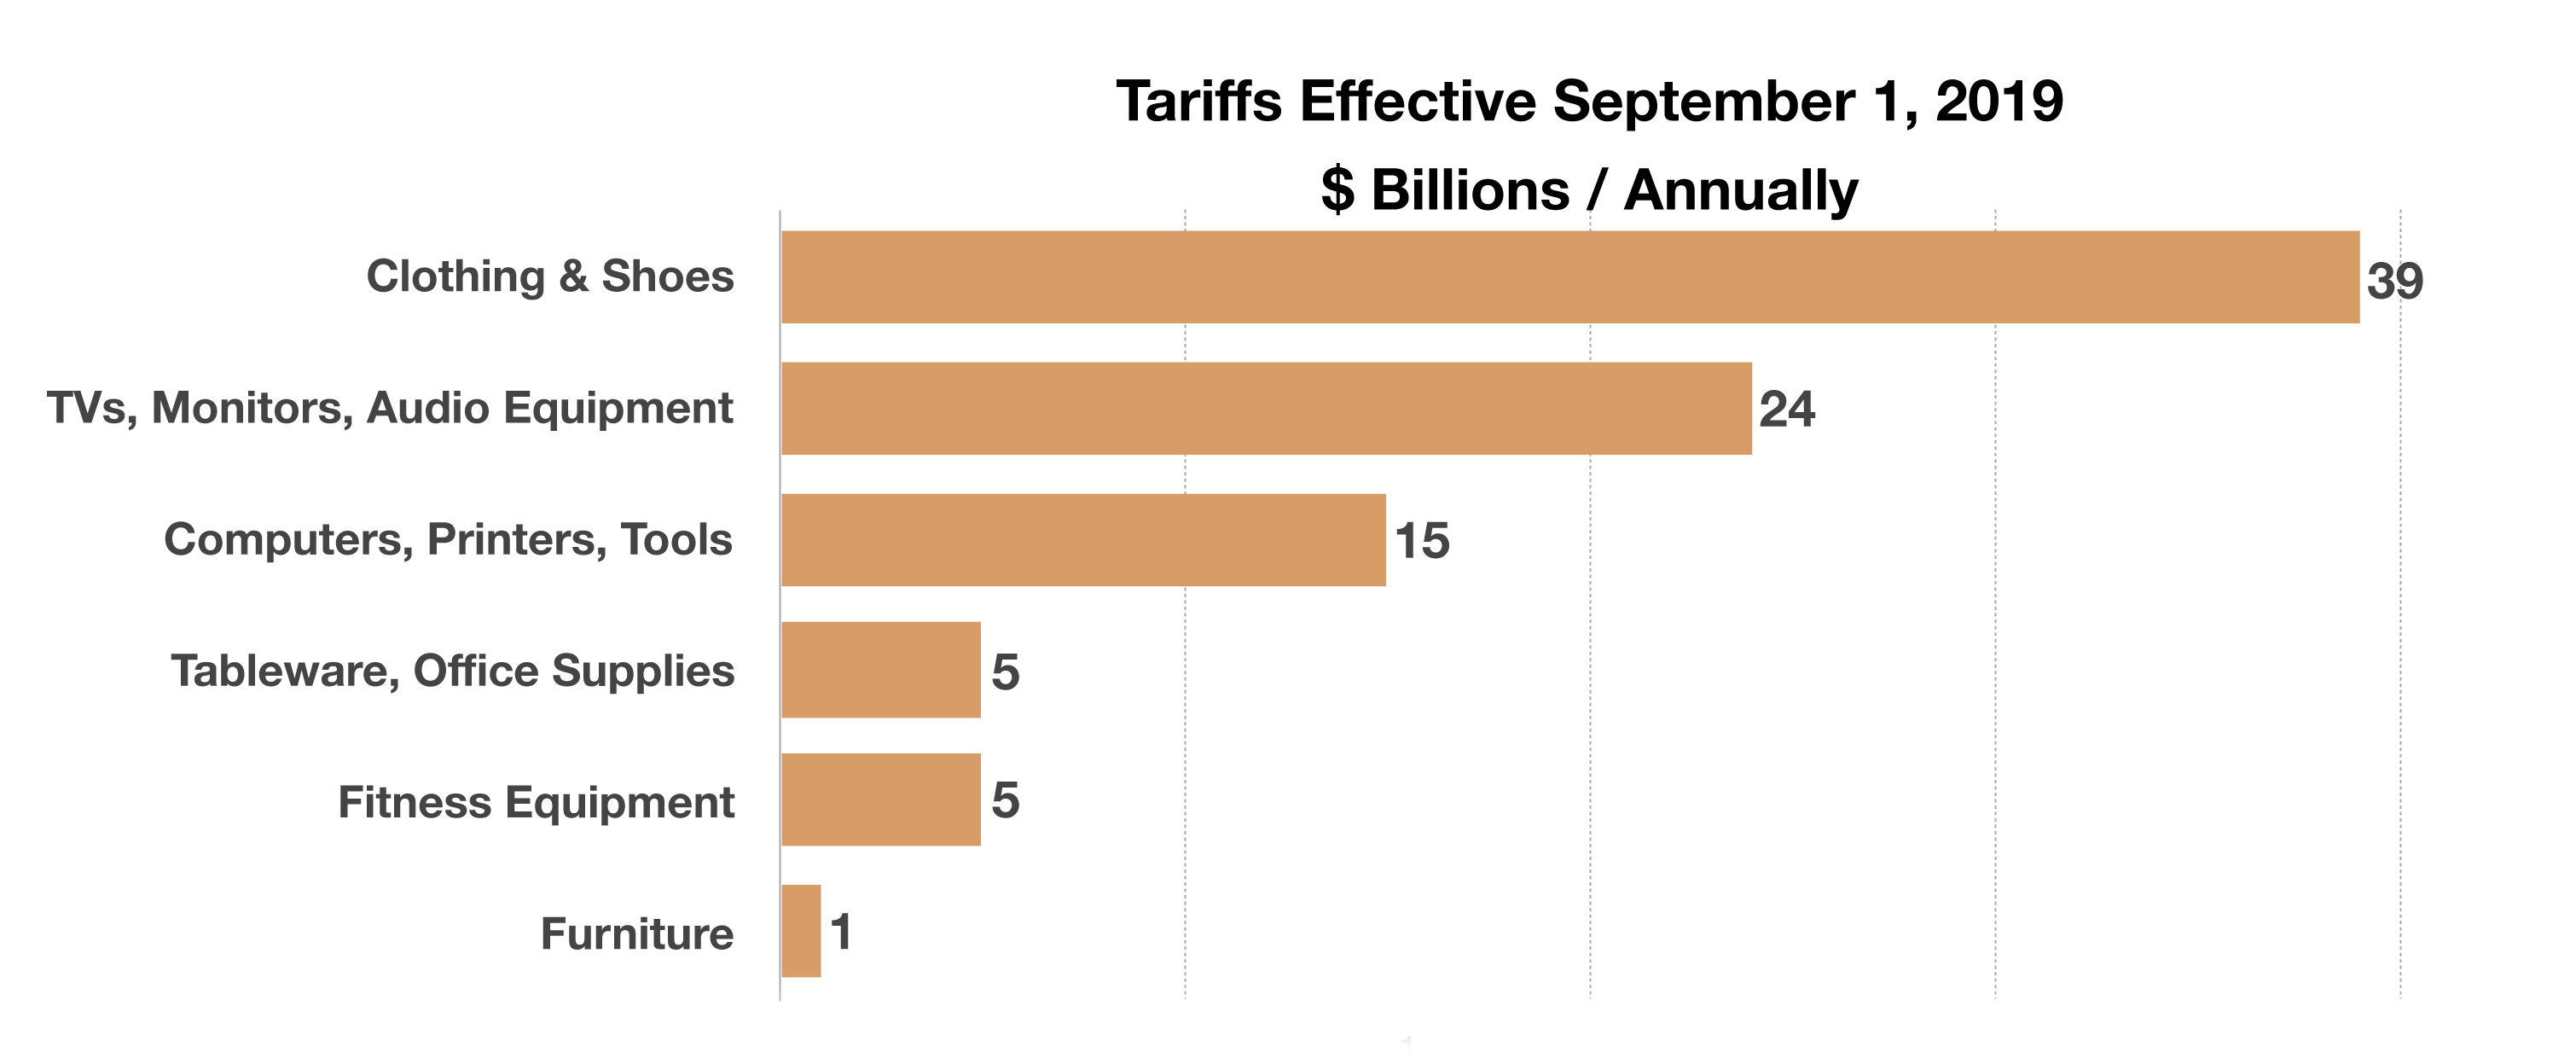
A 15% tariff was imposed on roughly 40% of consumer products imported from China effective September 1st, affecting over $100 billion worth of annual imports. An additional slew of products from China is scheduled to be assessed a 15% tariff on December 15th, applicable to nearly everything imported from China by year end.
The announcement of additional tariffs on Chinese imports into the U.S. caused prolonged uncertainty surrounding the extent of the ongoing trade tensions. Since tariffs are dictated by trade policy, some believe that a potential delay or reversal of a portion of the scheduled tariffs is possible.
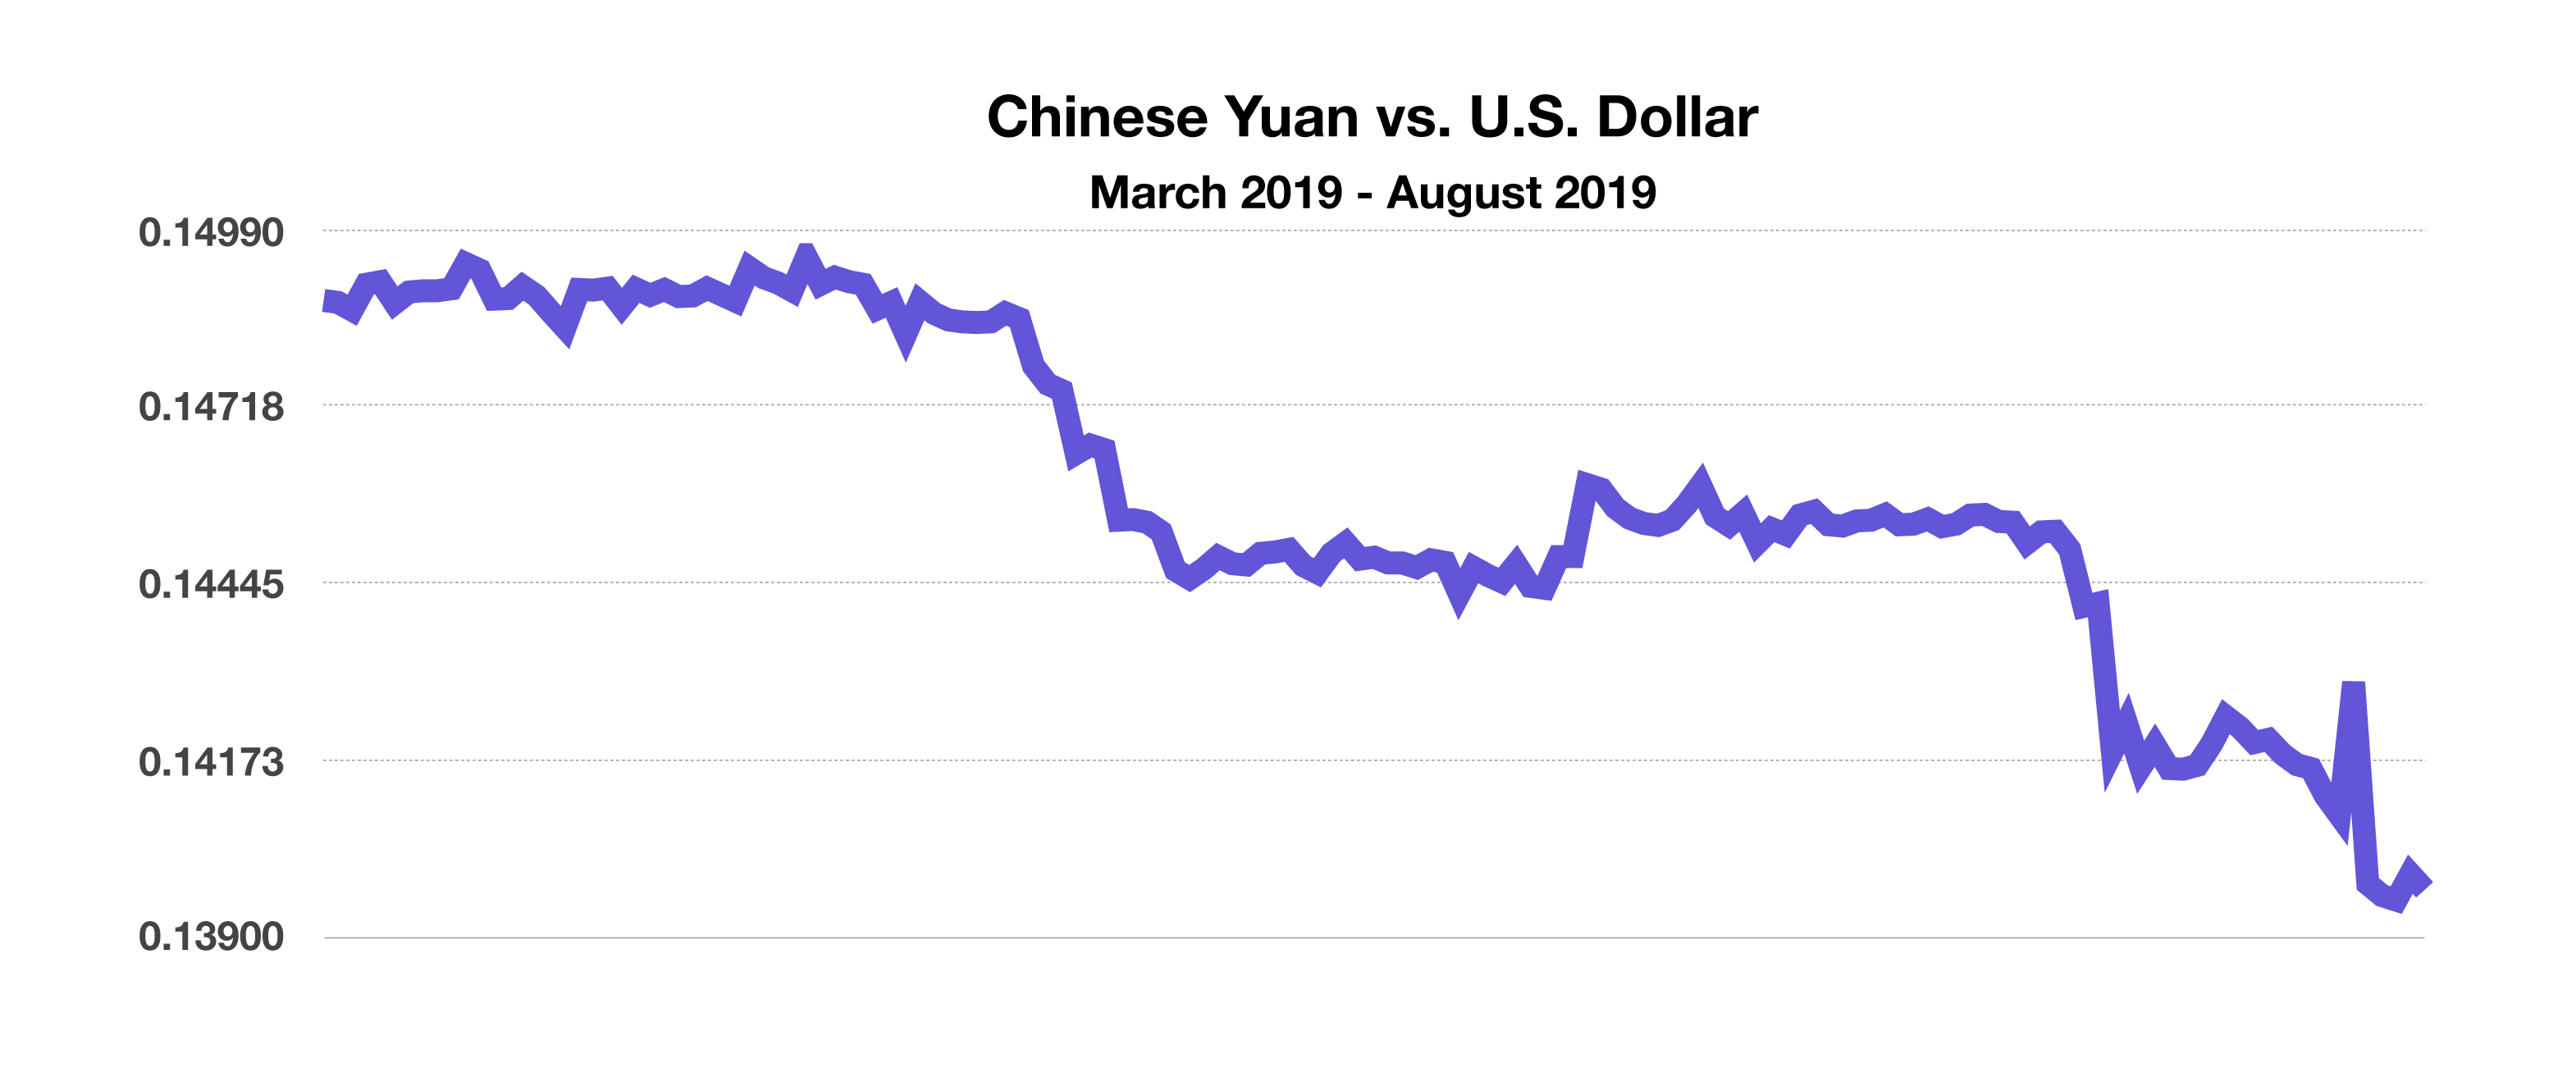
China let their currency, the yuan, fall in response to the U.S. decision to apply additional tariffs, thus weakening the Chinese currency and making Chinese exports more competitive internationally. Concurrently, the U.S. Treasury Department designated China as a currency manipulator in early August, a designation that addresses potential unfair trade practices. China’s currency fell 3.7% against the U.S. dollar in August, the single largest monthly drop in 25 years.
The Congressional Budget Office (CBO) estimates that the U.S. budget deficit will surpass $1 trillion in 2020 and continue to expand to over $1.3 trillion by 2029. The ten year projection is based on increasing tax revenue but with slower GDP growth of 1.8% per year.
Stocks have been resilient since the beginning of the year despite ongoing tariff threats, slowing global economy, softening earnings projections, and uncertainty surrounding international debt issues. All eleven sectors of the S&P 500 Index were still positive year to date as of the end of August.
Recession fears fueled volatility and uncertainty as bond yields continued to fall in August. Economists view higher short-term rates than long-term rates, also known as an inverted yield curve, as a signal of slowing economic growth in the future. Any validation of an upcoming recession is subjective with expectations varying from economist to economist.
Global yields continued their decline in August with 30-year German government bond yields falling below 0% while the 30-year U.S. Treasury bond yield dipped below 2% for the first time on record. Roughly $16 trillion worth of global bonds now carry negative yields, of historical significance in the fixed income markets.
Argentina is close to defaulting on its government debt, owing approximately $50 billion of long-term debt primarily held by foreign investors throughout the world. Argentina’s currency, the peso, fell 25% against the U.S. dollar in August, the steepest drop since its last currency crisis. (Sources: Commerce Dept., U.S. Treasury, Federal Reserve, CBO, Bloomberg, S&P)
Volatile Month For Stocks – Equity Overview
Despite the volatility in August, all eleven sectors of the S&P 500 were still positive YTD as of Aug 30th, with the technology, real estate and consumer discretionary sectors leading.
Earnings moved to the forefront of concerns for equities as the effect of Fed rate cuts dissipated with fewer cuts expected. Global growth headwinds along with international debt issues contributed to market uncertainty.
Equity analysts are following three primary market risks influencing U.S. stock prices: effects of trade tensions; slide in earnings estimates; and less Fed rate cuts than anticipated. (Sources: S&P, Bloomberg)
Bond Yields Continue To Decline – Fixed Income Update
Bond prices continued to escalate in August, causing bond yields across most bond sectors to fall. The bond market has been the primary identifier of recessionary threats for decades, as short-term bond yields rise above longer term bond yields. Long-term bonds have been among one of the best performing asset classes year to date concurrently with equities, an anomaly in the financial markets.
The yield on the 10-year Treasury bond fell to 1.50% in August, its largest monthly yield drop since 2011. The yield on the 30-year Treasury bond fell below 2% in August, confirming expectations of dismal economic long-term growth.
The U.S. Treasury is considering the issuance of 100-year Treasury bonds in order to take advantage of the current ultra-low rate environment. Other countries have already taken advantage of the global low rate environment, with Austria, Belgium and Ireland issuing century bonds over the past few years. (Sources: Treasury Department, Eurostat, Bloomberg)
What The New Tariffs Will Affect – Trade Policy Review
Even though tariffs are assessed on a wholesale level, most manufacturers are passing along new tariffs to consumers in the form of higher prices. Unlike prior tariffs applied to Chinese imports earlier in the year to unfinished materials and products, such as aluminum and components used for manufacturing purposes, the tariffs effective Sept 1st will affect mostly finished consumer products.
The tariffs will apply to products from clothing and shoes to furniture and computers. Sneakers, sweaters, pants, dresses and baby clothes all fall under a category worth roughly $39 billion in annual imports from China. Higher priced ticket items such as furniture products including chairs and sofas are worth roughly $1 billion in annual imports.
Prices on many of the newly affected products may not result in immediate price hikes at stores, as some retailers have stockpiled inventories of products with no assessed tariffs because they were imported before September 1st. (Sources: U.S. Department of Commerce)
U.S. Recessions – Historical Note
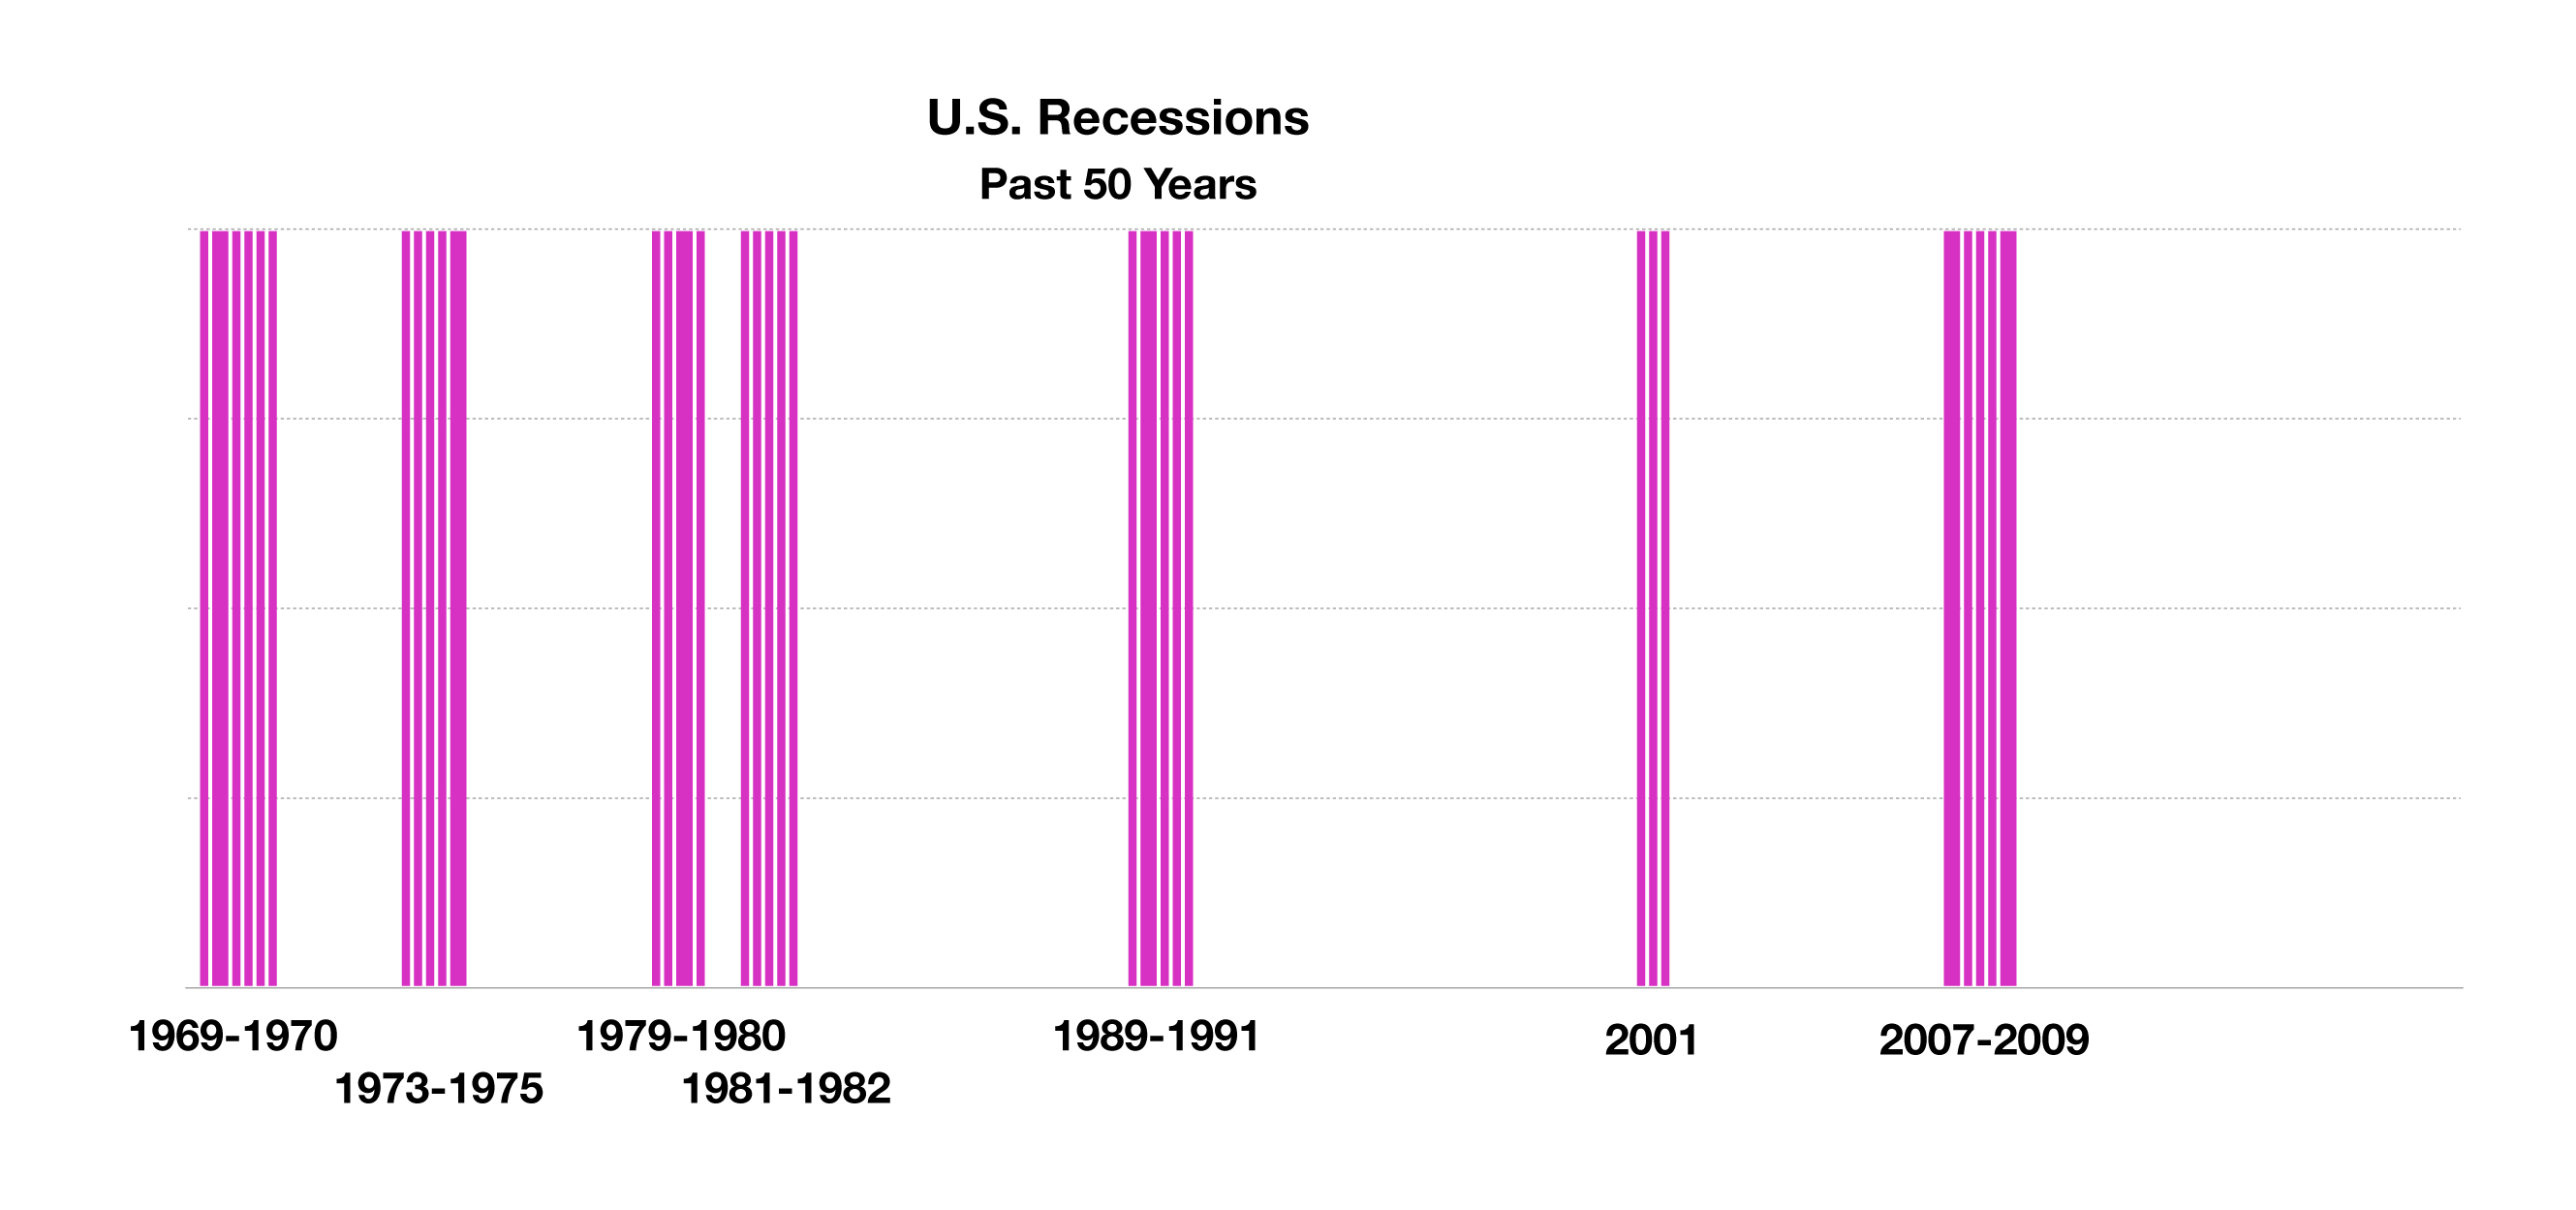
Historians and economists claim that there have been 47 recessions in the United States dating back to the Articles of Confederation, which was ratified in 1781. The duration and intensity of each recession has been unique, with various factors affecting economic conditions contingent on current circumstances.
Ironically, the recession during the early 80s from 1980 through 1982 was driven by inflation and rising interest rates creating an expensive and restrictive environment for consumers and businesses. Conversely, economists currently view any probable recession driven by an ultra-low rate environment and minimal inflation, believed to be a result of excessive stimulus created by the Federal Reserve and dismal economic growth projections.
Modern recessions occurring in the 19th century have resulted from financial crises and market driven events, while recessions that occurred in the 1800s were primarily driven by war and the weather due to the dependence on agriculture.
Talk of an upcoming recession in the news has been a focal discussion as low rates and weakening economic indicators create an argument for a recessionary environment. Economists and analysts see recessions as an economic cycle driven by expansions and contractions. (Source: Federal Reserve; fred.stlouisfed.org/series/JHDUSRGDPBR)
U.S. Treasuries Remain Attractive – Global Fixed Income Overview
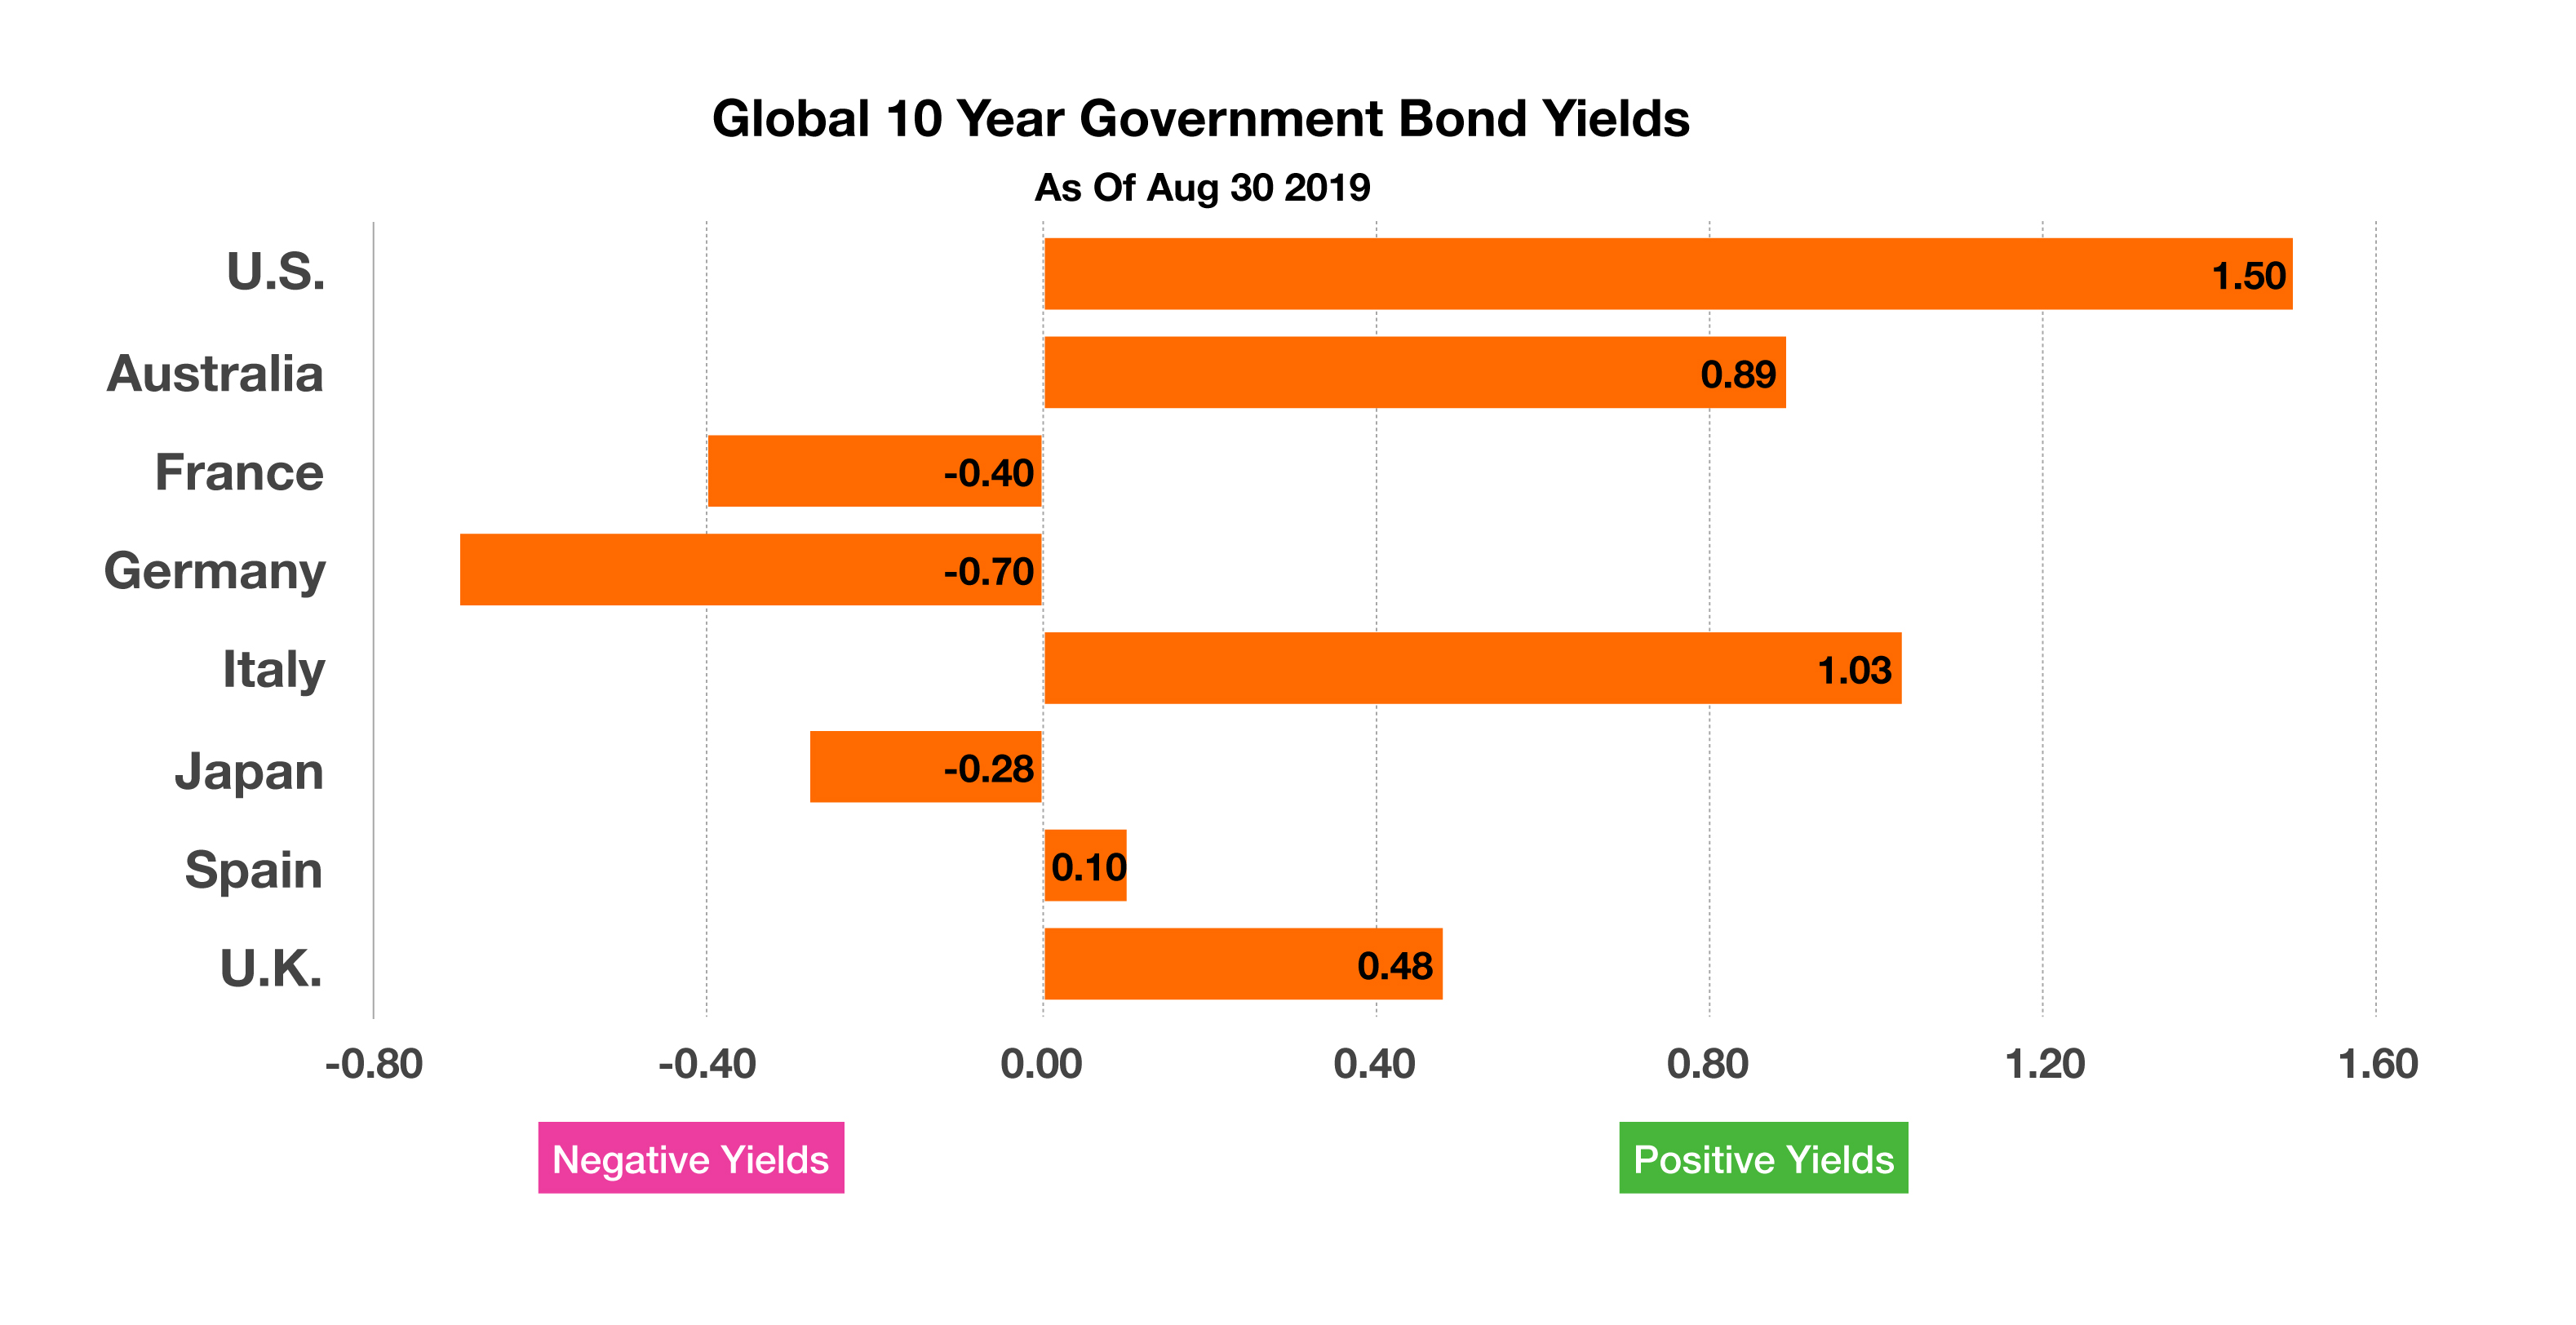
Even as the 10-year Treasury yield fell below 1.5% in August, it is still offering a more attractive yield than most other developed country government bonds. Yields for 10-year government bonds in Germany and Japan yielded -0.69% and -0.27% respectively. Such negative yields mean that investors are basically paying the governments of Germany and Japan to hold on to their funds. International investors not only pursue the best yields possible, they also seek the safest debt possible. The U.S. continues to offer the most transparent and liquid debt worldwide of any country or company. U.S. Treasury bonds are also held for trading purposes and for currency control. If too many bonds are bought, then lower rates may weaken the currency, a trade strategy utilized by countries to stabilize or alter exports. Developed countries whose 10-year government bond yields were below 0% as of the end of August include France, Germany and Japan. (Sources: Bloomberg, U.S. Treasury)
The Next Recession
If you watch the financial networks you would think that there was some magical way to avoid a recession as the never-ending question of the day seems to be “will we have a recession”. It seems the Fed has deluded itself and the investing public into believing it can somehow avoid a recession by micro-managing economic cycles with monetary policy. This is now the longest economic “expansion” and bull market in history and many younger investors who have never experienced what a real sell-off or crisis feels like seem to believe that asset prices only move one direction – up! The questions investors should be asking are when will the next recession occur, how severe will it be, what will be the catalyst and how to position their portfolios to protect their portfolios and even profit from the next recession.
As we noted on the previous page, recessions can vary greatly in duration and intensity. Some develop slowly as tends to be the case when the recession is the result of normal business cycles running their course or they can be brought on very quickly by a particular event such as 9-11 or the financial crisis. Crisis driven type recessions tend to be more severe and catch not only retail investors off guard but even the experts such as professional managers and even the Fed. In November of 2007, then Fed chairman Ben Bernanke told congress “Our assessment is for slower growth, but positive growth, going into next year”, one month later the economy entered into one of the worst recessions in history. Similarly, today we have Fed chair Powell stating on September 6th “we are not forecasting or expecting a recession, the most likely outlook is still moderate growth, a strong labor market and inflation continuing to move back up”. There are other eerie similarities to 2007 that are of note – in 2007 we also had an inverted yield curve, slowing growth, stocks made new highs in July (same in 2019) and an August correction (same in 2019) and the Fed cut rates in September (again, same in 2019). The number of coincidences are scary enough but what should add to the concern was what occurred in the Repo markets this week. Most investors probably have no idea what the Repo market is but it is basically the overnight lending rate. This week, liquidity in that market dried up and overnight rates spiked from low 2% to as high as 10%! While the reasons are still being debated, as Guy LeBas, chief fixed income strategist at Janney Montgomery put it
“The issue that worries me more is when financial rates spike like this, unpredictable events start to come up…random things that tend to precipitate financial crises”.
Another problem with predicting when the next recession will begin and what it will look like is the nature and length of the current expansion. This is now the longest expansion in history but it is also the weakest and for the most part has been fueled by unprecedented Fed intervention and not by the normal supply and demand factors that generally drive expansions. The response to the financial crisis was unprecedented intervention by both the government (tax breaks/credits, debt forgiveness, forced bankruptcies, etc.) and the Fed who immediately lowered interest rates to below 1%. Obviously this was not normal and many argue we would be better off now if things had been allowed to run their course but the reality is that ten years into this massive financial experiment many of these policies are still in place and any attempt to unwind them seems to send the expansion off the rails. On the next page we will begin our discussion on the most important of these stimulus and why it has the Fed hamstrung.
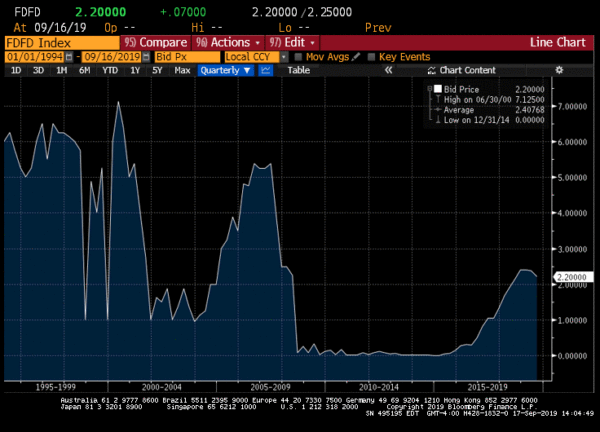
The Fed Funds Rate
The most effective and commonly used monetary policy tool the Fed has is the ability to raise and lower interest rates via the fed funds rate. The chart above shows the fed funds rate for the last 30 years. You may have heard the saying “the Fed is out of bullets” – well this is what running out of bullets looks like. The chart makes it clear that in the periods leading up to previous recessions, fed funds rates were starting out at much higher absolute levels. Prior to each previous recession, fed funds rates were between 5% and 7% and as recession fears began they quickly lowered rates. During this “economic expansion” the Fed was only able to raise rates to 2.40% before it began to hamper economic growth. Since this “expansion” was not the result of normal supply and demand factors we would normally expect from a growing economy but was mostly a product of free money policies, a small upward move in interest rates had a profound effect on growth. In other words, this economy is now more sensitive to small moves in interest rates than at any other time in history and shows how weak and tenuous this recovery has really been. Note on the graph note the duration of the low rate policy during this expansion compared to other cycles. Rates stayed below 1% for 8 years which has created an economy that is so dependent on “free money” that moving rates over 2% had a significant negative impact on the economy.
Going back to the “out of bullets” comment, how much can the Fed really stimulate the economy by moving rates from 2.4% to 1.5%? Is a 1% reduction from already historically low rates going to actually be an incentive for a corporation to take on new debt to finance a new plant or hire more employees? Of course not, the truth is the Fed is stuck and has become a victim of its own reckless policies and the desire of the Fed, politicians and the public to avoid another downturn at any cost. This long-term, low rate policy has fueled an unprecedented debt bubble and created an environment where investors are forced to engage in excessive speculation to earn acceptable returns.
In the past, low rates were used as a temporary tool to stimulate the economy – namely interest rate sensitive sectors such as housing. Low rates meant more affordable housing leading to an increase in home sales which in turn increased consumer spending on housing related goods and services. It also allowed corporations and individual to refinance more expensive debt resulting in more money to spend on discretionary items or for business expansion. This would kick start the economy and the Fed could begin to raise rates again. This time, as we have shown the economy never heated up enough to allow the Fed to raise rates thus we have ended up with historically low interest rates for 10-years. It took 7 years before they were able to slightly move rates above 0.625% and within 2 years they have had to start lowering again. Low interest rates can be good but long-term artificially low interest rates can have significant negative effects:
EXCESSIVE SPECULATION – With interest rates near zero investors have been forced to chase asset prices higher in order to find returns. Institutional investors cannot simply sit on the sidelines and wait for rates to rise, often they have liabilities to fund (insurance companies, banks) or they are paid to outperform and index (money managers, hedge funds) and their very jobs depend on them doing better than the “other guy”.
DEBT BUBBLE – Global debt has now reached over $240 trillion. Every type of debt imaginable now sits at record levels including governments debt, household debt and corporate debt. The sheer size of this debt makes it nearly impossible for the Fed to raise interest rates as the cost of refinancing the debt would make covering the interest unsustainable for many of the borrowers resulting in defaults.
CREDIT QUALITY – Most of the largest institutional investors are heavily invested in fixed income (bonds) and with rates at near zero they have had to get creative with their investments to earn an acceptable return. This huge appetite for yield has caused these investors to throw caution to the wind and take excessive risk which in turn enables companies with poor credit profiles to issue debt at levels that do not reflect the actual risk of default. Non-financial corporate debt now sits at about $16 trillion or about 75% of GDP which is a 50% increase since the financial crisis of 2007. Nearly a third of that debt is in the form of levered loans, which are covenant and document lite and high yield bonds (junk or non IG). Many of these companies are referred to as “zombie companies” because without low interest rates and easy money they would cease to exist. This has created a situation which we have discussed at length in previous newsletters where investors are now accepting some of the lowest risk premium and the worst terms (covenants) in history while investing at historically and artificially low interest rates. With so much aggregate debt even small upward moves in interest rates mean massive losses for debt holders.
The factors we have discussed thus far make it more difficult than any other time in history to predict when a recession will occur and what it will look like. But there are some factors that we can use as a guide as to what the next recession will look like and why it is different than previous recessions.
DURATION OF EXPANSION – The fact that this is now the longest expansion in history and also the weakest is probably a clue as to the timing of the next recession. This expansion is obviously already long in the tooth which might lead investors to believe the end is getting close. However, we have never seen a Fed so willing to take unprecedented steps to avoid the inevitable which makes it anybodies guess as to how long they can keep this up. The election is in 2020 and many very smart people believe that Trump will do whatever it takes to keep us from a recession (although we believe his ability to do so is limited – the President doesn’t run the fed or have short-term tools to spur economic growth). Most “experts” are calling for a recession in 2020 or 2021 but we believe that is the outside number and that it could begin much sooner.
FED SHOOTING BLANKS – As we discussed with rates already historically low there is only so much the Fed can do at this point. With fed funds at 2% already, realistically how much stimulus will cutting them to 1% produce? As we noted in the chart, in previous recessions the fed had 5% – 7% fed funds rates which gave them a lot of ammo to stimulate the economy but today find themselves with almost no room to cut and this will add to both the length and severity of the next recession.
UNPRECEDENTED DEBT LEVELS – The sheer size of the debt markets will ensure that this recession will be more severe than usual and will affect every individual and organization (companies, governments, financial institutions, etc.) and all regions and sectors of the economy.
EXCESSIVE SPECULATION – The excessive speculation that has been taken on in the form of low quality debt will almost guarantee this recession will be more severe and lengthy than normal. Once the domino’s start to fall zombie corporations will begin to fail at record rates which will send high yield spreads to historically high levels causing bond prices to plummet. This will spill over into the investment grade corporate bond market and many companies that are currently rated low IG (BBB) will be downgraded making it more difficult for all companies to issue debt to refinance or finance their ongoing operations. As companies get downgraded, this will force institutional investors that have strict guidelines as to how much junk-rated debt they can hold to liquidate and they will find few buyers which will further exacerbate the price declines (see below).
LESS LIQUIDITY – Due to well meaning regulations after the last crisis many of the institutions you would expect to step up and provide liquidity will simply not be there to do so. Not only are there fewer primary broker-dealers but the ones that exist have limited balance sheets to work with and will not be able to provide orderly markets to the forced sellers. During the financial crisis it was the dealers themselves that were being forced to liquidate and were unable to provide liquidity so there is some historical precedent as to how a lack of dealer support will affect bond prices. Without dealers to support the markets and provide liquidity, bond prices plunged to distressed levels – it was pandemonium and sellers found their bonds to be worth whatever someone was willing to pay at that moment which was often far below what they believed the actual value to be and often there was no bid at all.
Preparing For a Recession
The best way to prepare for a recession and the eminent decline in asset prices is reduce risk levels by increasing the quality of your holdings and increasing liquidity. As simple as this sounds it is very difficult to do in practice. As we have stated, institutional investors cannot simply sit on the sidelines and must stay relatively fully invested if they expect to keep up with their peers or meet their liabilities. If they increase their quality too much they will be getting lower returns which forces them to take excessive risk to outperform and generally they pay is based on outperformance. While individual investors can easily take their money and put it in CD’s or money market funds (or cash in the mattress) it is difficult for most people to do so when they are constantly seeing their 401k rise or their neighbors getting rich (on paper) buying the next greatest biotech or internet stock. Greed is more powerful than fear at this point and many investors have fooled themselves into believing that this time is different and that their assets can only increase in value. Most individual investors pay very little attention to their investments and only occasionally review their investments and even fewer take the time to really look at the underlying investments in their mutual funds.
We are not advocating sitting on actual cash or taking zero risk only that at this point in the cycle and given the circumstances we have discussed investors should look to reduce their risk and increase their liquidity. Fixed income investors should shorten their maturities and raise the credit quality of their holdings. As we have discussed at length in previous newsletters, investors are not being rewarded for either term or credit risk so there is little reason to take either at this point. The difference between the yield on a 10-year bond and 2-year bond is insignificant (negative in the case of treasury bonds) but the downside price risk on a 10-year bond can be massive compared to a 2-year.
Profiting From the Recession
When the next downturn finally does arrive liquidity will be king. While this is almost always the case it will be especially pronounced during the coming recession as forced bond sellers will have very few alternatives and will be forced to take whatever bid they can get. We saw this during the financial crisis as large broker-dealers were going bankrupt and there was nobody there to provide liquidity. Savvy investors such as hedge funds picked up distressed mortgage debt at pennies on the dollar which provided high double digit returns for years. The next downturn in credit will not be caused by mortgages or secured bonds like 2007 but by corporate debt but the carnage will spill over into all sectors of the bond market and create once in a lifetime opportunities (as did 2007).
The bond market is not like the stock market where there is a readily available 2-sided market and where all participants can participate on an equal playing field regardless of trade size or account status. For instance, the bid that a large institutional client might receive on $10 million of a particular bond will almost certainly be points above what an individual or even smaller institution would receive for the exact same bond. When liquidity dries up, even large accounts like Pimco or Doubleline will have a hard time selling their holdings because generally if they are being forced to sell an issue it is because it has been downgraded or the name is out of favor and all the other managers are being forced to sell as well – the buyers disappear which drives prices to artificially low levels. Investors with liquidity like hedge funds that have been waiting on such an opportunity will step in at that moment and provide the necessary liquidity but at distressed prices. We believe that when the next recession and inevitable drop in equities that the spike in volatility and lack of liquidity will give investors the opportunity of a lifetime for those who have had the discipline to stay liquid.
Other Considerations:
YIELD CURVE – The yield curve has flattened and many areas of the curve are inverted. Historically this has precipitated a recession.
VALUATIONS – At over 20x earnings, the S&P is stretched compared to the long-term average of 15.7x.
GLOBAL GROWTH – Global Growth is slowing and at 2.9% it is the weakest since the 2008 financial crisis. GDP growth in the U.K. and Germany have turned negative.
TRADE WARS – Whatever your political leaning, trade wars are generally not good for the economy and could be a possible impetus for recession.
Key Points
RECESSION RISK – A recession is inevitable however the timing, duration and severity are unknown.
DURATION OF EXPANSION – This is the longest expansion in history and the weakest and has only been kept alive by central bank interference and not true demand side economics.
INTEREST RATES – Interest rates have been historically low for an excessive and unnecessary length of time with short term rates below 1% for nearly 10 years.
EXCESSIVE RISK – Low interest rates have fueled excessive risk and investors are recieving an historically low premium for taking risk.
GLOBAL DEBT BUBBLE – Low interest rates have fueled a virtual debt orgy and debt of every type has now reached historic levels and sits at over $240 trillion.
RECESSION RISK – A recession is inevitable however the timing, duration and severity are unknown.
The bottom line is that nobody can accurately predict when any recession will begin and this economic cycle is especially puzzling and unpredictable. We are in uncharted waters on multiple fronts including the length of this expansion, unprecedented debt levels and historically low interest rates. There is $16 trillion in negative yielding debt which is seemingly having little or no impact. Most economist are calling for a recession in 2020 or 2021 but we believe it could happen much sooner and be triggered by a “black swan” that most will never see coming. The recent activity in the overnight lending markets could be a warning sign as these types of events tend to occur before a crisis.
Investors should take caution and lighten up on risk. Fixed income investors should shorten maturities and increase credit quality. Liquidity will be king in the next downturn and there will be significant opportunities for those who can provide it. Investors need not sit in cash to be liquid – a short bond portfolio that produces heavy cash-flow can be constructed and still earn 5% – 6%. Considering the S&P is projected to return 10% in 2020, the expected incremental return of 3%-4% seems insignificant compared to the downside risk should a recession or crisis occur.