Ocean Park Capital Management

2503 Main Street

Santa Monica, CA 90405

Main: 310.392.7300

Daily Performance Line:  310.281.8577

August 2020
Market Update
(all values as of 04.30.2024)

Stock Indices:

Dow Jones 37,815
S&P 500 5,035
Nasdaq 15,657

Bond Sector Yields:

2 Yr Treasury 5.04%
10 Yr Treasury 4.69%
10 Yr Municipal 2.80%
High Yield 7.99%

YTD Market Returns:

Dow Jones 0.34%
S&P 500 5.57%
Nasdaq 4.31%
MSCI-EAFE 1.98%
MSCI-Europe 2.05%
MSCI-Pacific 1.82%
MSCI-Emg Mkt 2.17%
 
US Agg Bond 0.50%
US Corp Bond 0.56%
US Gov’t Bond 0.48%

Commodity Prices:

Gold 2,297
Silver 26.58
Oil (WTI) 81.13

Currencies:

Dollar / Euro 1.07
Dollar / Pound 1.25
Yen / Dollar 156.66
Canadian /Dollar 0.79
 

Portfolio Overview

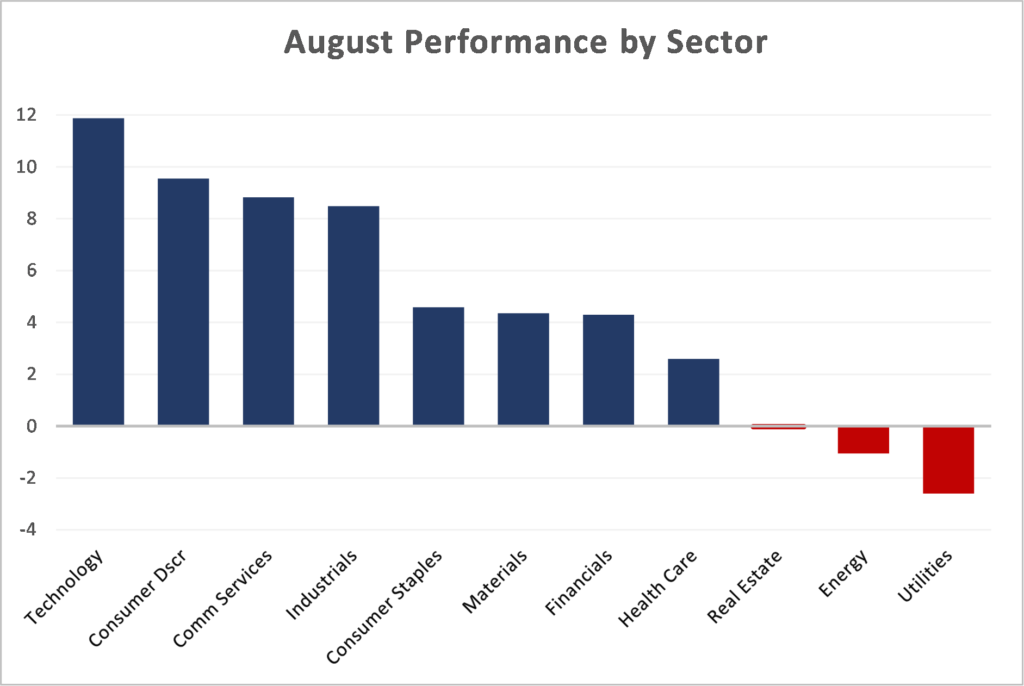
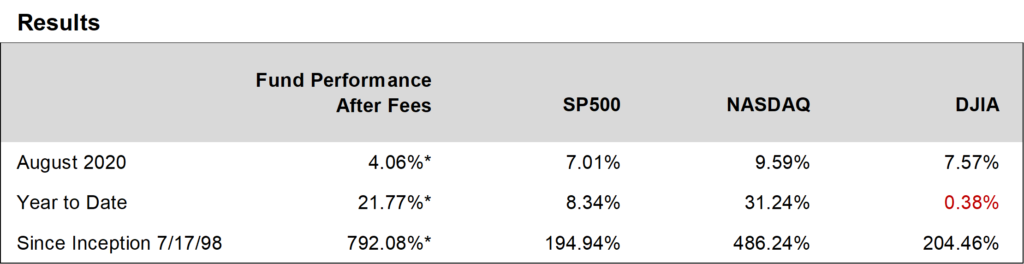
Ocean Park Investors Fund rose 4.06%* in August, roughly in line with the HFRI Equity Hedge Index (which rose 4.25%) and less than the gain posted by the S&P 500 (up 7.01%). For the year to date through August we continued to outperform the S&P 500:  the fund was up 21.77%* and the S&P 500 was up 8.34%.  Among the positions which buoyed our results for the month were Apple (up 21%), Nvidia (up 25%), and Zoom Video Communications (up 28%).

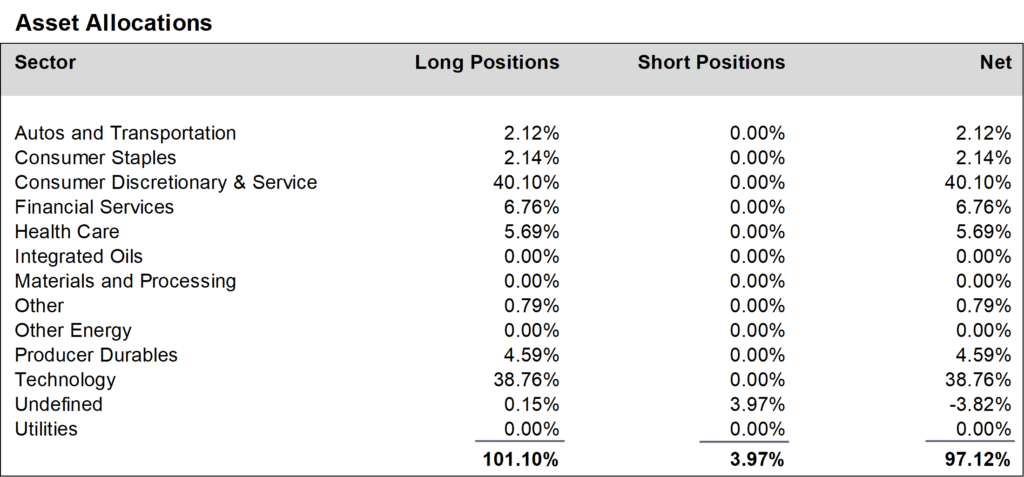
During August, we increased positions in the consumer staples sector and reduced positions in the healthcare sector.  Exclusive of our short position in QQQ options, we finished the month at about 97% net long, up from about 94% in June.  However, taking into account our QQQ short option hedges, our effective net long exposure was closer to 80%.


Daily updates on our activity are available on our Results Line, at 310-281-8577, and current information is also maintained on our website at www.oceanparkcapital.com. To gain access to the site enter password opcap.

*These results are pro forma. Actual results for most investors will vary. See additional disclosures on page 4. Past performance does not guarantee future results.

 
Equity Overview

Equity Overview

Continuing the July rally, stocks posted broad gains in August.  The S&P 500 and the NASDAQ Composite both hit all-time highs.  Tech stocks led the way, followed by consumer discretionary stocks.  Real estate, energy, and utilities lost ground.  Growth stocks generally outperformed value stocks.  Volatility remained modest.

Second quarter corporate earnings reported in August reinforced the positive trend set in July.  With 98% of S&P 500 companies reporting, 84% beat consensus earnings estimates and 65% beat consensus revenue estimates, in both cases meaningfully above the one-year and five-year averages.  And the blended earnings growth rate came in at negative -31.8%, better than the July number (-35.7%) and significantly better than the analyst consensus at the beginning of the quarter (-45%).


Macro Overview

Macro Overview

The stock market soared in August on hopes for an early return to economic growth and the development of a Covid-19 vaccine.  Whether those hopes will be realized remains to be seen.  In the meanwhile, economic data reported in August were mixed.  Manufacturing, retail sales, real estate, and durable goods orders all posted gains.    The Commerce Department revised its estimate of 2nd quarter GDP upward to
-31.7% annualized, modestly better than its initial estimate of -32.9%.  But unemployment remained at historic levels and consumer confidence fell.  The temporary $600 per week unemployment insurance increase, which provided significant support for consumer spending, expired with no indication that Congress can agree on an extension.

The Federal Reserve continues to backstop the economy by indicating that it will keep interest rates extremely low for years to come.  But the Fed’s control of monetary policy cannot make up indefinitely for the failed fiscal policy that our legislative and executive branches have created.  Our national debt now exceeds our GDP, a phenomenon which occurs in countries such as Greece when they are on the verge of collapse—but which has always been viewed as inconceivable for the United States.  Bond rating agencies have taken note:  Fitch downgraded its outlook for U.S. debt from stable to negative, and Moody’s suggested it may do the same.  For the moment, investors worldwide still look to U.S. government securities when there is a flight to quality.  But that can change.  If it does, and the government is required to pay significantly higher rates to finance our enormous debt, the impact on our economy may be severe.  Hopefully wiser heads will prevail in Washington before that happens.


Additional Disclosures

Additional Disclosures

Performance data for OPI reflect the reinvestment of dividends and other earnings on the fund’s assets.  Performance data for the major indices reflect only changes in the value of those indices, and would be higher if dividends were included. However, the index data do not reflect fees that would be paid to index fund managers and transaction costs that would be incurred when their component stocks are bought or sold, while OPI’s data do reflect quarterly fees and expenses incurred by the fund.  The information provided is believed to be reliable, but its accuracy or completeness is not warranted. This material is not intended as an offer or solicitation for the purchase or sale of any stock, bond, mutual fund, or any other financial instrument. The views and strategies discussed herein may not be appropriate and/or suitable for all investors. This material is meant solely for informational purposes, and is not intended to suffice as any type of accounting, legal, tax, or estate planning advice. Any and all forecasts mentioned are for illustrative purposes only and should not be interpreted as investment recommendations.