September 2020
Market Update
(all values as of 04.30.2024)

Stock Indices:

Dow Jones 37,815
S&P 500 5,035
Nasdaq 15,657

Bond Sector Yields:

2 Yr Treasury 5.04%
10 Yr Treasury 4.69%
10 Yr Municipal 2.80%
High Yield 7.99%

YTD Market Returns:

Dow Jones 0.34%
S&P 500 5.57%
Nasdaq 4.31%
MSCI-EAFE 1.98%
MSCI-Europe 2.05%
MSCI-Pacific 1.82%
MSCI-Emg Mkt 2.17%
 
US Agg Bond 0.50%
US Corp Bond 0.56%
US Gov’t Bond 0.48%

Commodity Prices:

Gold 2,297
Silver 26.58
Oil (WTI) 81.13

Currencies:

Dollar / Euro 1.07
Dollar / Pound 1.25
Yen / Dollar 156.66
Canadian /Dollar 0.79
 

Macro Overview

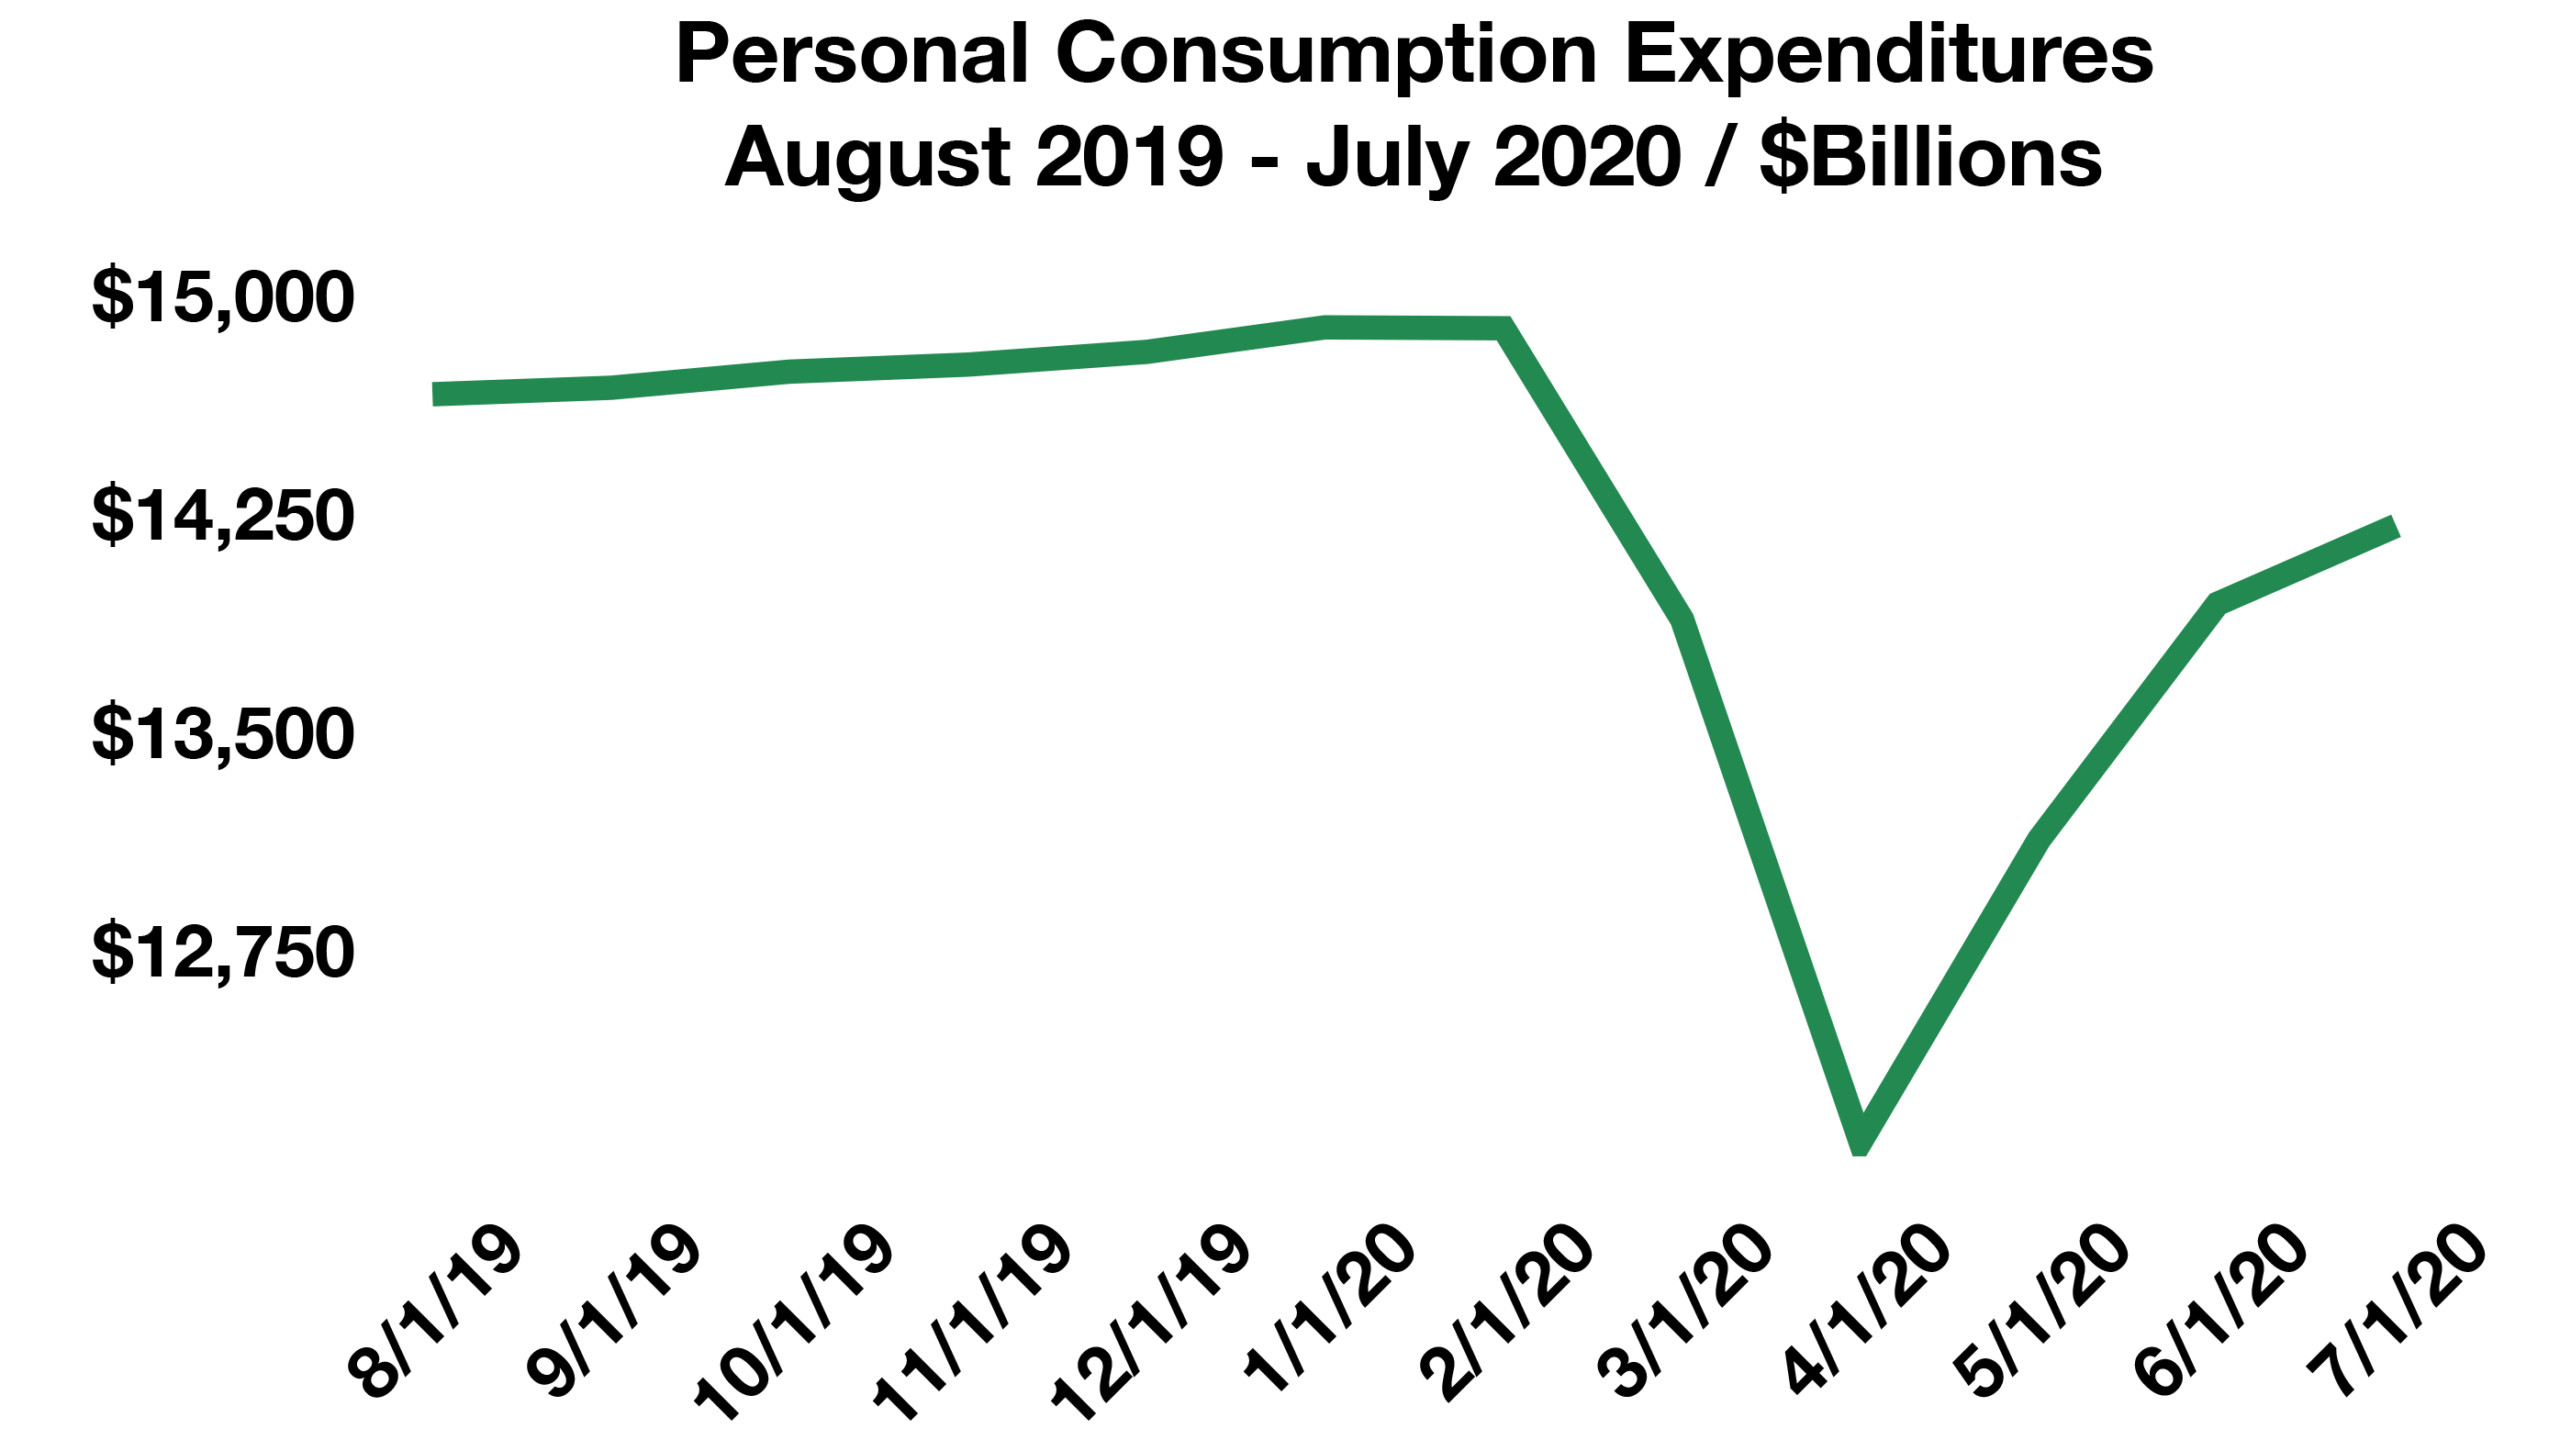
U.S. equity indices rebounded in August to pre-pandemic levels that were last reached in early March of this year. The dramatic recovery in equity valuations came about very quickly and unexpected by numerous market analysts and economists. 

The Federal Reserve is expected to leave short-term rates near zero for up to five years in order to allow inflation to expand modestly throughout the economy. The Fed believes that inflation will be muted until economic activity picks up again as the effects of the pandemic reside.

The U.S. government has mistakenly sent $1.6 billon of stimulus payments to dead U.S. citizens. The Government Account Office (GAO) reported that the payments were made quickly and without proper verification with other government agency databases, such as Social Security.

The Paycheck Protection Program issued 5.2 million stimulus loans totaling $525 billion as of August 8th, when the program closed. Another round of stimulus funding for businesses may be included in a new bill drafted by Congress.  

U.S. consumer confidence fell in August to the lowest levels since 2014, as noted by the Conference Board’s index. Sentiment among consumers regarding employment and business expectations hastened.

The U.S. dollar fell to a two-year low against other global currencies, as expanding government debt issuance and uncertainty surrounding the coronavirus weighed on the currency. Credit rating agency Fitch revised its outlook on U.S. government debt from stable to negative, citing ongoing deterioration with public finances and the absence of a credible fiscal consolidation plan.

In response to incomplete and irrelevant data, the U.S. Census Bureau began gathering data designed to identify the financial and social impact of the pandemic on the lives of Americans across the country. The experimental Household Pulse Survey, which is compiled by the Census Bureau, started collecting data in April following the onset of the pandemic.

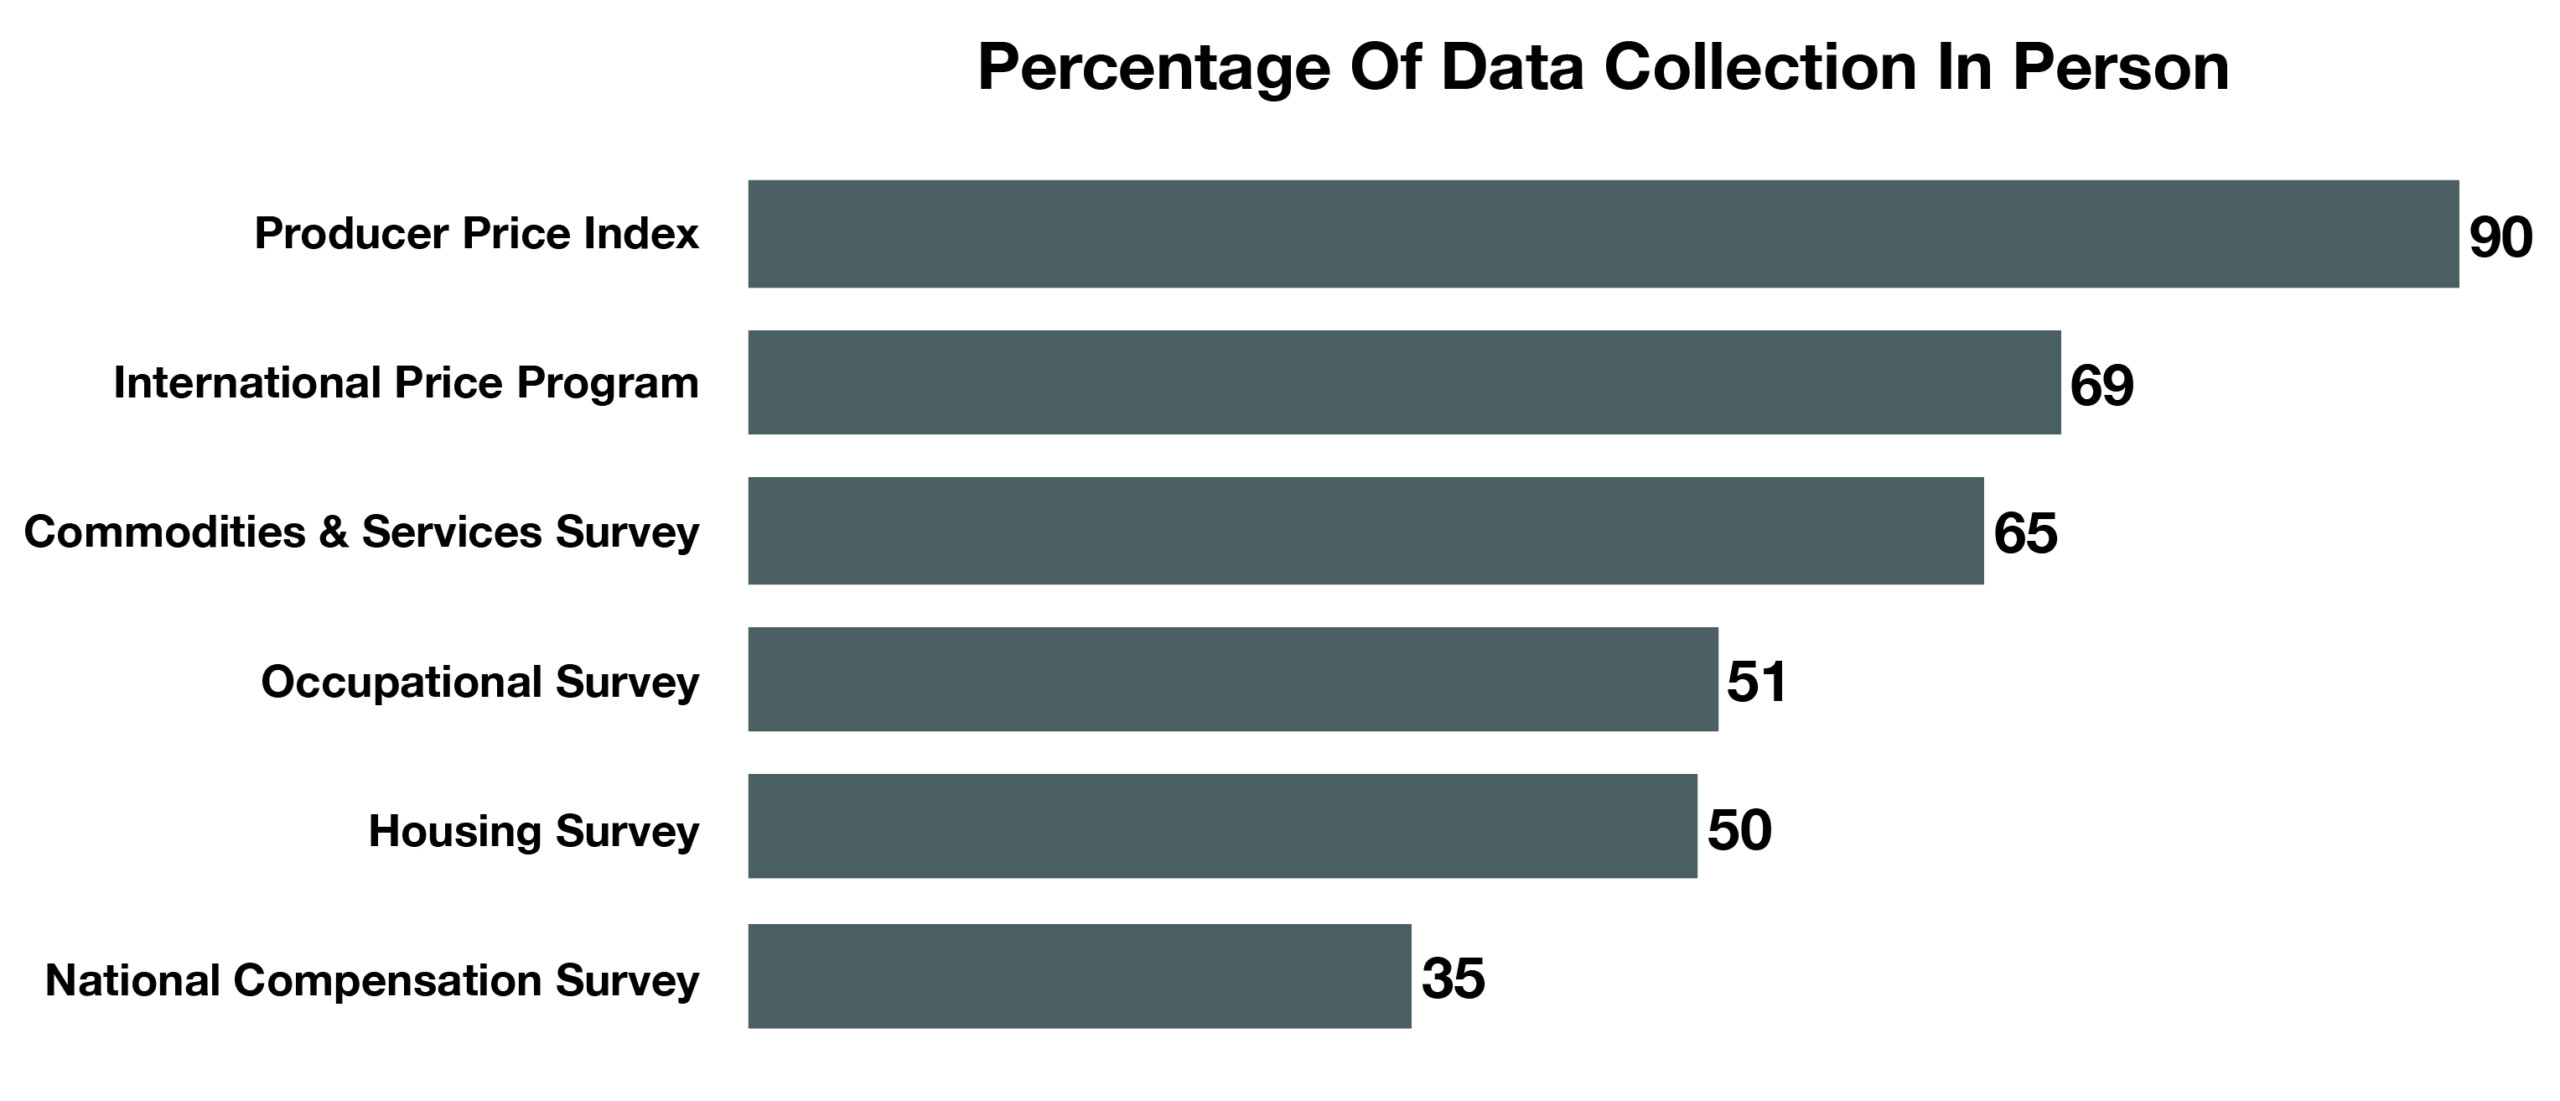
Data collection efforts by several federal agencies and departments have been hindered by the pandemic, raising questions as to the accuracy of data collection affecting various government indices and economic gauges.

Sources: Federal Reserve, GAO, USPS, Moody’s, Fitch, U.S. Census Bureau

 
Over $1 trillion of mortgage bonds have been purchased by the Fed since March

Rates Rose Slightly In August – Fixed Income Update

Rates rose slightly in mid-August, following a weaker than expected auction for U.S. government bonds. The yield on the 10-year treasury rose from 0.55 in early August to 0.71 in mid-August, representing nearly a 30% jump within two weeks. The rapid rise in rates also lifted mortgage rates and other consumer lending rates, which had already fallen substantially since late March. 

The Federal Reserve communicated an extended period of near zero short-term rates over the next five years as it expects inflation to be mild. The announcement sent longer term bond yields higher versus shorter term bond maturities.

Over $1 trillion of mortgage bonds have been purchased by the Federal Reserve since March of this year. The ambitious buying spree is meant to help sustain the housing market as jobs and incomes have faltered during the pandemic. Lower mortgage rates are expected to remain in place encouraging homeowners to refinance and buyers to purchase. (Sources: Federal Reserve, U.S. Treasury)

Equity Markets Driven Higher In August – Domestic Market Overview

The recovery of U.S. stocks from the depths of the market turmoil in March, when the pandemic became official, has been unprecedented. Equity values returned to where they were before the pandemic in August. The rebound in equity indices has been one of the strongest in nearly 90 years, propelling indices to new highs this past month.

Technology stocks continued to lead other sectors, with the widest gap in performance in 30 years. Substantial monetary and fiscal stimulus over the past five months helped elevate stocks in addition to better than expected earnings for various sectors and industries. Some analysts believe that it has become a policy driven market, rather than economic driven, meaning that interest rate policy and tax policies are becoming more consequential. (Sources: Bloomberg, Reuters)

Pandemic Driven Spending May Not Be Consistent – Pandemic Effects

Spending soared in July to a record 8.2%, reported by the Commerce Department, accompanied by an increase in personal income which rose 10.5% in April.

Many analysts and economists believe that spending among U.S. consumers following the onset of the stimulus payments may be misleading, with any increase in spending merely temporary, as the benefits of the payments fade. Income figures may also be skewed as stimulus payments and generous unemployment benefits have artificially increased incomes for some lower income families.

Source: U.S. Commerce Department

 
IRS collected $28 billion in 2010 from audits & only $11 billion from audits in 2019

Less Choices Are Here To Stay – Consumer Behavior

In response to the COVID-19 pandemic, American consumer choices have changed in the realm of diet, food preparation, and lifestyle habits. The transition into at-home cooking as a means of financial saving and risk reduction has expanded through American society and is projected to leave both short-term and long-term effects on consumer choices.

In addition to consumer impact, retailers are also experiencing drastic changes in food choices as a result of the pandemic; grocery stores have begun to reduce food options while large corporate retailers have also transitioned into limited offerings. Consumer choice reductions by American retailers have resulted from stressed supply chains and market preferences leaning towards familiar brands.

The short-term effects of the pandemic on consumer choices across industries are projected to shift long-term as some companies plan to commit to fewer choices post pandemic.  Restaurants have begun reducing menu options in order to mitigate extensive labor or supply costs that would often be needed in a growing and expanding food industry. The automotive industry is also feeling the effects of the pandemic and many automakers have begun the transition to limited supply and variety in hopes to salvage extraneous costs within the supply chain and decreased sales. 

Uncertainty regarding the long-term effects of consumer choices remains, though some retailers have approached the transition with permanence and voiced limited desires to return to broadened product choices. The immediacy and simplicity created by fewer choices for both the retailers and consumers lends the debate towards the permanence or temporary incentives behind retailers’ consumer choice reductions long term. (Sources: U.S. Department of Agriculture; Economic Research Service)

COVID Is Making It Difficult For The IRS To Audit & Collect Taxes Owed – Fiscal Policy

As the pandemic has taken a toll on income for individual businesses, companies, and families across the country, it has also taken a toll on U.S. government income. The IRS releases a disclosure annually of the sources of income collected from taxes. Part of the revenue generated by the IRS is the enforcement of tax collections primarily via audits. The IRS report revealed that the number of audits in 2019 was among the lowest in decades for individual returns, the single largest source of income for the IRS.

Fewer audits means less revenue for the U.S. government, which has this year already issued over $3 trillion in debt since March of this year. The IRS collected roughy $28 billion in 2010 from audits, versus $11 billion that was collected in 2019.

This year has become that much more challenging, as IRS employees and agents have been removed from the field due to pandemic restrictions. The inability to perform face to face audits has made it that more difficult for the IRS to collect on taxes owed.  (Sources: IRS Annual Disclosure Report, IRS Data Book 2019 Release)

 
inflation for seniors is 1.3% versus 1% for the traditional CPI in the past year

Government Data Collection Hindered By The Pandemic – Economic Dynamics

Among the many disruptions caused by the pandemic, government data collection has been hindered considerably. Various agencies and departments of the federal government have relied on personal collection of data for decades as a reliable and validated process of gathering data.

Numerous economic indicators and indices are vital for economists and government officials to decipher what the economic condition of the country might be. The pandemic has now raised the question as to whether data collection has been flawed and if certain government provided reports are truly accurate. 

Natural disasters such as hurricanes and fires have affected data collection efforts in the past as face to face surveys have been delayed if not limited in scope. The significance of the current pandemic though, has created data collection challenges that have never occurred before.

The Bureau of Labor Statistics has acclimated to the new environment by instituting surveys by telephone and by examining publicly available data. Inflation has been difficult to gauge, as random price spikes over the past few months have misled economist and the Federal Reserve. The Consumer Price Index (CPI) not only is the leading indicator for inflation, but it is also used to modify and establish tax rates, Social Security benefits, poverty thresholds, and eligibility requirements for food stamps.  (Sources: BLS, U.S. Census, Dept of Labor, Federal Reserve)

Inflation Even Higher For Those Over 62 – Retirement Planning

Data compiled by the government via the Bureau of Labor Statistics (BLS) maintains a separate tally of inflation for people over 62. The rarely heard of index, known as the CPI-E, is a variation of the traditionally recognized CPI (Consumer Price Index), but with an emphasis on goods and services mostly used by  those over 62 years of age. This past month, the recent release of the CPI-E and the CPI reveled an inflation rate of 1.3% for the CPI-E versus a 1% rate for the traditional CPI over the past year.

The modified index has actually been increasing at a faster pace of inflation over the past decade versus the CPI. The CPI-E assigns a larger weight to senior related expenses such as medical services and housing. The index was first created in 1987 when Congress directed the BLS to help identify inflationary pressures among seniors. The index represents roughly 25% of all U.S. consumers.

Source: Bureau of Labor Statistics