KCG Investment Advisory Services

Kimberly Good

315 Commercial Drive, Suite C1

Savannah, GA 31416

912.224.3069

www.kcginvestmentadvisory.com

September 2023
Market Update
(all values as of 09.30.2024)

Stock Indices:

Dow Jones 42,330
S&P 500 5,762
Nasdaq 18,189

Bond Sector Yields:

2 Yr Treasury 3.66%
10 Yr Treasury 3.81%
10 Yr Municipal 2.63%
High Yield 6.66%

YTD Market Returns:

Dow Jones 12.31%
S&P 500 20.81%
Nasdaq 21.17%
MSCI-EAFE 12.90%
MSCI-Europe 12.10%
MSCI-Pacific 13.80%
MSCI-Emg Mkt 16.80%
 
US Agg Bond 4.44%
US Corp Bond 5.32%
US Gov’t Bond 4.39%

Commodity Prices:

Gold 2,657
Silver 31.48
Oil (WTI) 68.27

Currencies:

Dollar / Euro 1.11
Dollar / Pound 1.33
Yen / Dollar 142.21
Canadian /Dollar 0.73
 

The quickest way to get rich quick in the market is with concentrated positions.
The best way to keep what you have is through diversification.
It is the beginning of the last quarter in 2023.  To recap, 2022 was all about risk aversion and then many investors spent the first half of 2023 chasing the narrow leadership of the magnificent 7 rather than the broader market.  Both extreme positions…and the market is really not that easy.  Personally, I feel like the magnificent 7 has been reduced to 2 – Alphabet and Nvidia.  And especially now, my preference remains a well-diversified portfolio of low-correlation assets.  While diversification can reduce return, conserving assets means launching from a higher point next time the market rises.

One of KCG’s screening targets when selecting stocks or funds, is to identify holdings which capture more of the upside of market moves than downside.

As discussed last month, the broader market started performing nearer expectations in about the middle of June.  As is historically true, August and September were rough months.  We were hoping to breathe a sigh of relief in October, but now we are faced with an unprecedented Middle-East conflict that started over the weekend.  While most sectors held moderate losses throughout the day, we are keeping an eye on commodities, energy, and the VIX (which measures volatility).  By end-of-day, Energy, gold and silver let the diversified S&P 500 up ~25 points and the Dow 30 up 169 points.

To summarize my thoughts…
1.  The law of supply and demand remains reliable.  Shortages in energy will push the prices up, not only on a barrel of oil, but on all items that require fuel to deliver or produce.  (This will also cause further inflation and higher yields – a good news = bad news scenario for the economy.  But the economy is resilient…)
2.  The new market cycle brings new leadership.  The magnificent 7 are far over-priced and the weakness in  financials is significant.  Shortages in energy and commodities are worth watching.
3.  If I had been chasing the magnificent 7, I would be considering capturing what gains remain from their rise in 2023.  After they led 2022 down, it would have required about 2x to recover to 0% gains.  As I read in a recent a newsletter by Richard Bernstein Advisors, “It’s never too early to sell a bubble!”

My final recommendation?  Stay the course… steady as we go.


30-year mortgage rates reached 7.23% in august

Consumer Rates Remain Elevated – Fixed Income Overview

Interest rates experienced some volatility in August due to uncertainty surrounding inflationary pressures and intended Fed policy. Elevated rates on consumer loans such as credit cards and mortgages continued to place pressure on shoppers and home buyers.

The yield on the 10-year Treasury bond closed the month at 4.09% after reaching 4.34% in August. The average rate on a fixed 30-year mortgage fell to 7.18% in late August, down from 7.23% earlier in the month. Rates this same time a year ago averaged 5.66% on a 30-year fixed mortgage. Some analysts believe that rates may have started to change course, as the Fed ponders holding back from further rate increases. (Sources: U.S. Treasury. Federal Reserve)

Pullback In August Affects Equity Indices – Domestic & International Equity Update

Domestic stocks experienced a retraction in August as future earnings came into focus along with lingering inflationary pressures on company expenses. The S&P 500 fell -1.6%, culminating in the second monthly decline so far in 2023. The Dow Jones Industrial Index as well as the Nasdaq declined with similar pullbacks. September has historically been a volatile month for the indices as uncertainty before the year end and government fiscal mayhem have hindered equity performance.

Energy was the only sector of eleven sectors in the S&P 500 Index that was positive for August. Such broad pullbacks in multiple sectors are closely watched by analysts as an indication of a possible broadening of market weakness.

International and emerging market equities saw a more substantial pullback in August, with the developed market MSCI EAFE Index retracking -4.1% and the emerging market MSCI EMG MKT Index declining -6.36%. Currency volatility in addition to global expansion concerns fueled the overseas markets. (Sources: Dow Jones, S&P, Nasdaq, Bloomberg, MSCI)

Producer Prices Heading Lower, What It Means – Producer Inflation

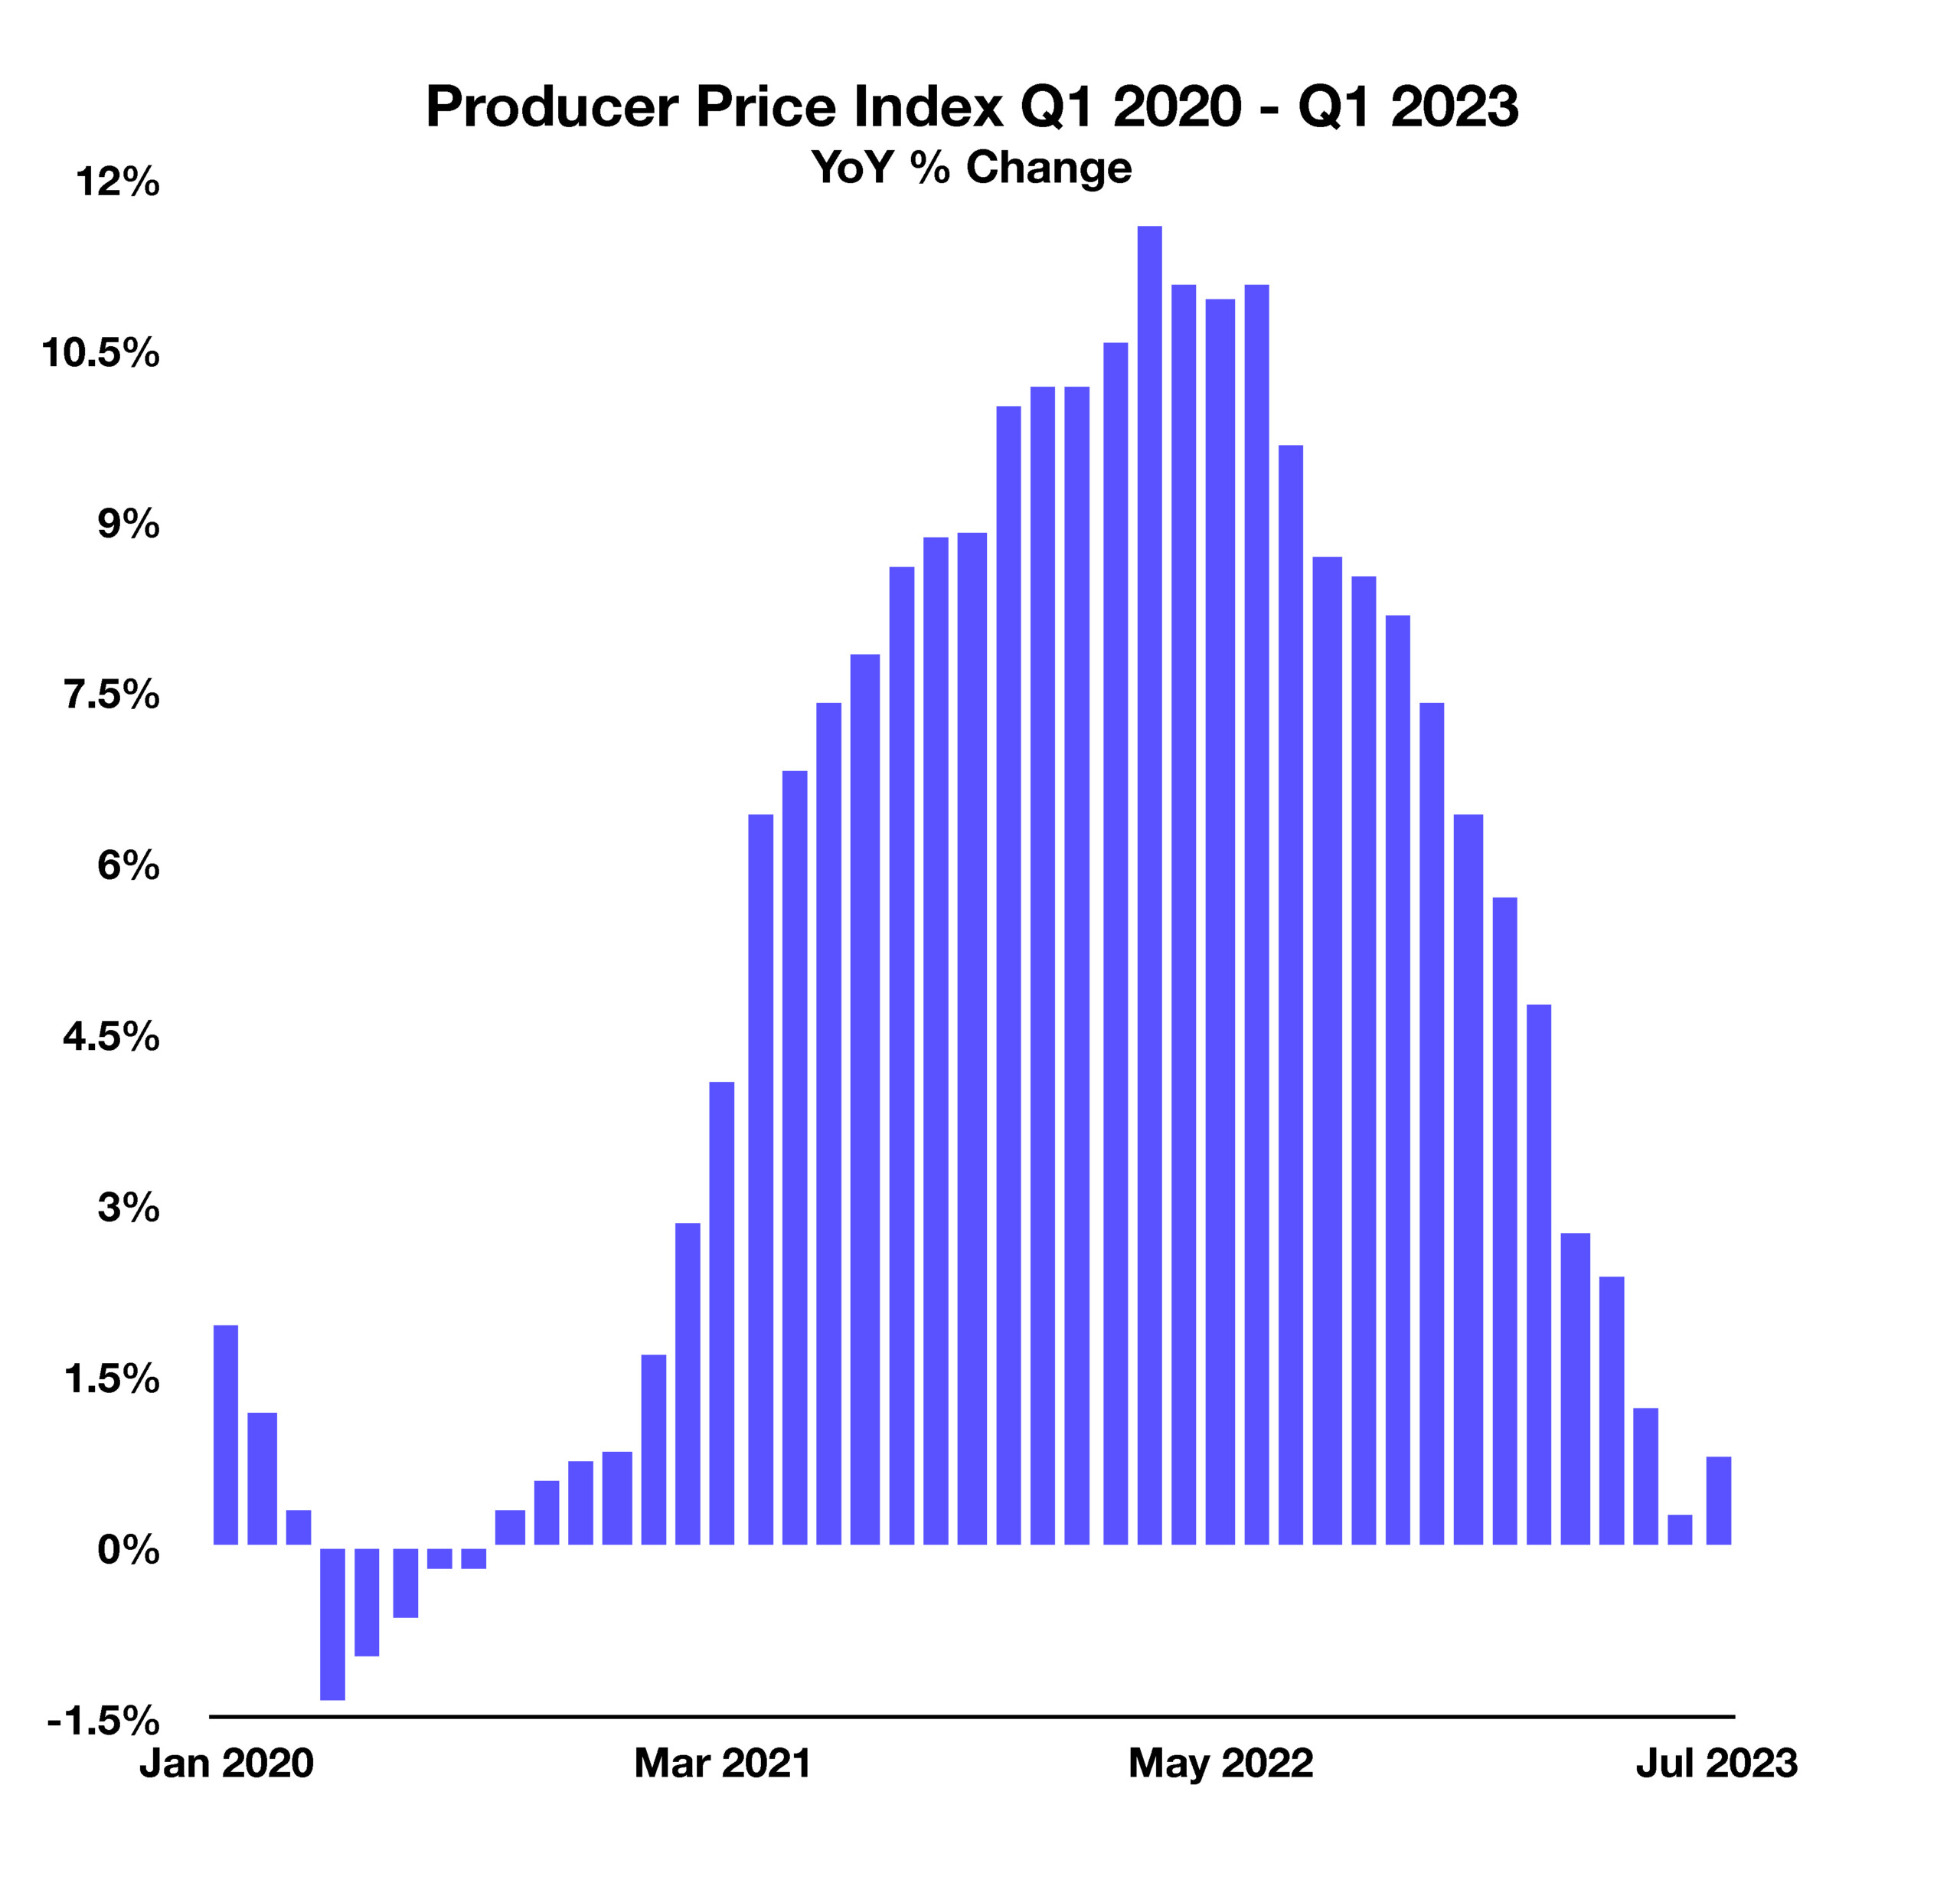
The Producer Price Index (PPI) measures the selling prices domestic companies receive when purchasing everything from raw materials to products themselves. Similar to how the Consumer Price Index (CPI) tracks prices consumers pay for goods, the PPI tracks prices that corporations pay.

With the PPI steadily decreasing to its lowest growth rate since 2020, corporations are now forced to pay far less for commodities than previously. This affects companies across a wide variety of industries and is a leading indicator of what may soon trickle down to CPI. With companies paying lower prices, consumer prices have historically followed and continue their downward path as has been exemplified in recent months.

Sources: U.S. Bureau of Labor Statistics, Federal Reserve Bank of St. Louis


30-year mortgage rates fell to 2.65% in 2021, the lowest in history

Housing Market Is Among The Least Affordable In U.S. History – Housing Market

Measured by the Housing Affordability Index, the affordability of homes has been steadily eroding since early 2021. Factors affecting affordability include home prices, mortgage rates, and household incomes. With historic inflation outpacing income growth, home buyers in the U.S. have been unable to keep up with rising prices and mortgage rates.

When the Fed increases interest rates to combat inflation, mortgage rates are similarly affected. The average 30-year mortgage rate rose to a high of 7.24%, the highest since 2001. This is a significant difference to the lows reached in 2021 when the average 30-year mortgage fell to 2.65% mortgages, the lowest in U.S. history. This creates a less affordable environment for home buyers and harms potential buyers’ abilities to acquire property.

First-time buyers are forced to either buy a home knowing they may not be able to afford it or continue renting until affordability rises. For those who already own a home, remaining in their current house instead of buying a new one has been increasing in popularity as well. (Sources: National Association of Realtors, Federal Reserve Bank of St. Louis, Freddie Mac)

How Deflation & Inflation Affect High Income & Low Income Earners – Inflation Review

As inflation has taken center stage over the past year, consumers among all demographics have been affected in various ways. Consumers know inflation as the overall increase in the cost of goods and services, from shoes to gasoline. However, products that are essential for everyday life can be more costly for some than others, such as food, healthcare, and toilet paper. These products usually make up a larger portion of expenses for lower-income consumers and less for higher-income earners. In essence, inflation can be much more of a challenge for lower-income earners as less disposable income is left for more desirable items.

Fortunately, consumers have the ability to control what they buy when inflation sets in, such as buying hamburgers instead of steak. This is where consumer choice is critical as to where the economy is heading and what companies might benefit more than others.

As the economy slows and lower prices eventually settle in, a deflationary environment evolves pulling certain asset prices down. Historically, lower asset prices affect higher income earners with assets, rather than those with little or no assets. Deflation may affect the prices of assets such as homes, cars, stocks, and commodities.(Sources: U.S. Bureau of Labor Statistics, OneBlueWindow Editorial Staff)


credit card delinquency rates reached their highest level in over a decade

Delinquency Rates On The Rise – Consumer Finance

A survey released by the Federal Reserve Bank of Dallas found that overall credit and lending activity is deteriorating nationwide. The survey encompasses loan activity among larger banks, regional banks, finance companies, and various lenders.

The primary concern of this report centers around rising delinquency rates on credit cards, which indicates ongoing trends pertaining to consumer behavior. Consumers have become more accustomed to taking on debt, which declined during the pandemic. However, consumers are now financing an increasingly high level of purchases, which has also driven up rates of delinquency.

This is of particular interest to economists, who view this dynamic as a worrying sign for consumer spending. In 2023, credit card delinquency rates reached their highest level in over a decade, surpassing levels last seen in late 2012. When consumers increasingly take on debt which they are unable to pay back, it creates a delinquency cycle that poses financial duress for consumers. Delinquency rates fell substantially in 2021 as pandemic assistance funds helped alleviate the debt burden of millions of credit card holders, yet catapulted back up once those funds were exhausted.(Sources: Board of Governors of the Federal Reserve System, Federal Reserve Bank of St. Louis, Federal Reserve Bank of Dallas)

New Mortgage Rules To Accommodate Lower Credit Scores – Lending Overview

New mortgage rules are attempting to make homes more accessible to home buyers with low credit scores by lowering the fees for low-credit buyers while, in some cases, raising the fees for high-credit buyers. This new fee restructuring revolves around what Fannie Mae calls “loan level price adjustment costs” and what Freddie Mac refers to as “credit fees.” Having become effective on May 1, these two agencies increased their risk-based fees, which are intended to protect the agencies from borrowers deemed as more likely to default on their payments. However, in an attempt to make homes more affordable for individuals without large savings, their adjustments instead lowered fees for purchasers with smaller down payments. On a conventional mortgage, borrowers who now put down payments between 5% and 25%, which are considered larger down payments, will pay more in fees than those who put down less than 5% of the home’s value. Thus, the higher fees are impacting those who are considered less risky. While purchasers with high credit scores will still be charged lower fees than purchasers with low credit scores, the disparity between fees will be reduced. This is intended to offset the risks of supporting purchasers with riskier credit, whom Fannie Mae claims may not have large savings or help from family or friends like their peers with higher credit scores.(Sources: Freddie Mac, Fannie Mae)