Ocean Park Capital Management

2503 Main Street

Santa Monica, CA 90405

Main: 310.392.7300

Daily Performance Line:  310.281.8577

August 2023
Market Update
(all values as of 04.30.2024)

Stock Indices:

Dow Jones 37,815
S&P 500 5,035
Nasdaq 15,657

Bond Sector Yields:

2 Yr Treasury 5.04%
10 Yr Treasury 4.69%
10 Yr Municipal 2.80%
High Yield 7.99%

YTD Market Returns:

Dow Jones 0.34%
S&P 500 5.57%
Nasdaq 4.31%
MSCI-EAFE 1.98%
MSCI-Europe 2.05%
MSCI-Pacific 1.82%
MSCI-Emg Mkt 2.17%
 
US Agg Bond 0.50%
US Corp Bond 0.56%
US Gov’t Bond 0.48%

Commodity Prices:

Gold 2,297
Silver 26.58
Oil (WTI) 81.13

Currencies:

Dollar / Euro 1.07
Dollar / Pound 1.25
Yen / Dollar 156.66
Canadian /Dollar 0.79
 

Portfolio Overview

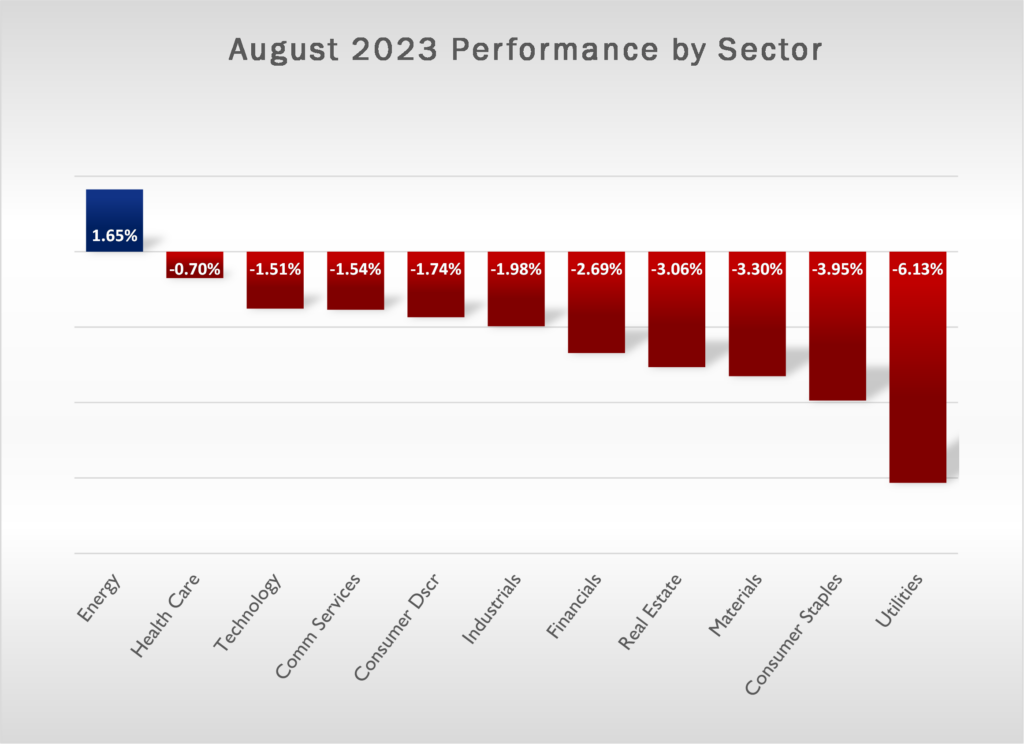
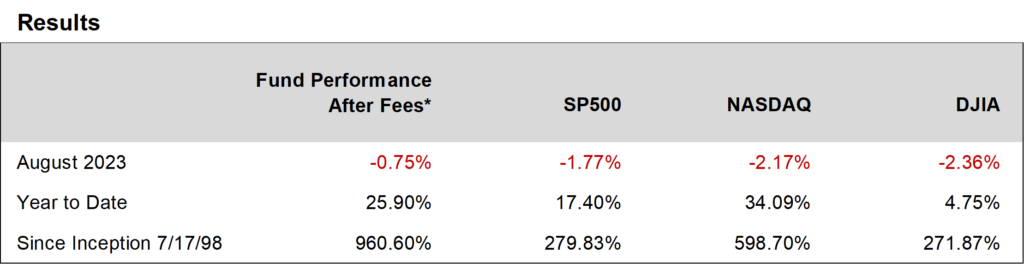
Ocean Park Investors Fund fell 0.75%* in August, while the S&P 500 fell 1.77% and the NASDAQ Composite fell 2.17%.  Portfolio holdings in consumer stocks gained ground led by ELF Beauty (up 19%), but holdings in technology stocks faltered.

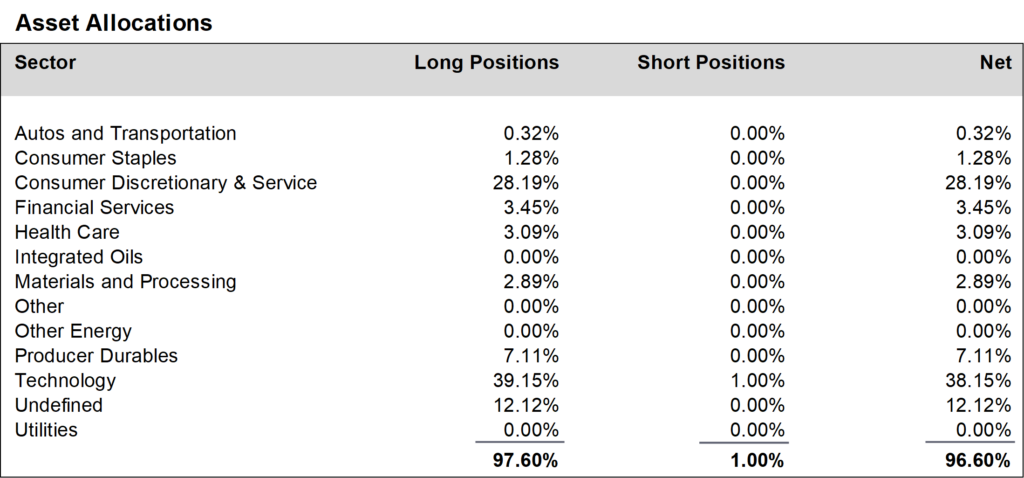
During August, we increased positions in the consumer discretionary and service sector and reduced positions in the technology sector.  Notable changes included:  initiating positions in Abercrombie and Fitch, Ross Stores, Teledyne, and TJX; selling Louisiana Pacific and Ralph Lauren after disappointing earnings; and trimming Advanced Micro Devices and Walmart.  We finished the month at about 97% net long, unchanged from July.


Daily updates on our activity are available on our Results Line, at 310-281-8577, and current information is also maintained on our website at www.oceanparkcapital.com. To gain access to the site enter password opcap.

*These results are pro forma. Actual results for most investors will vary. See additional disclosures on page 4. Past performance does not guarantee future results


Equity Overview

Equity Overview

Ten of eleven sectors in the S&P 500 declined in August, with energy the only gainer and utilities the worst loser.  Volatility was modest, as the S&P 500 moved more than 1% on 5 of 23 trading days.

Second quarter earnings continued the strong trend set in July.  With 84% of S&P 500 companies reporting, 79% have beaten consensus earnings expectations which is better than the five-year average.  However, only 65% have beaten consensus revenue expectations, which is below the five-year average.  The anomaly which we noted last month continued in August, as the stock prices of companies reporting earnings beats, on average, dropped 0.5% during the period two days before earnings release to two days after.  If this decline continues to the end of the reporting season, it will mark the largest negative reaction to earnings beats since 2011.


Macro Overview

Macro Overview

Economic headlines in August were a mixed bag.  Manufacturing activity rose much more than forecast and climbed into positive territory for the first time since September 2022.  Retail sales were strong, and the unemployment rate of 3.5% was lower than expected.  However, job creation was weaker than expected.  And consumer confidence fell as credit card debt rose to an all-time high above $1-trillion.

Consumer prices rose 3.2% year-over year, up from 3.0% in the previous month, ending a streak of 12 straight monthly declines.  With that in mind, Chairman Powell kept the door open to further interest rate hikes, noting that “we are attentive to the fact that the economy may not be cooling as expected” and “it is the Fed’s job to bring inflation down to our 2% goal, and we will do so.”

Government dysfunction in Washington generated a real-world consequence as Fitch Ratings downgraded U.S. credit from AAA to AA+, citing expected fiscal deterioration and a growing debt burden after repeated debt limit standoffs.  This bumped us out of the highest tier which includes Germany and Switzerland, and into a lower category where our neighbors are Austria and Finland.


Additional Disclosures

Additional Disclosures

Performance data for OPI reflect the reinvestment of dividends and other earnings on the fund’s assets.  Performance data for the major indices reflect only changes in the value of those indices, and would be higher if dividends were included. However, the index data do not reflect fees that would be paid to index fund managers and transaction costs that would be incurred when their component stocks are bought or sold, while OPI’s data do reflect quarterly fees and expenses incurred by the fund.  The information provided is believed to be reliable, but its accuracy or completeness is not warranted. This material is not intended as an offer or solicitation for the purchase or sale of any stock, bond, mutual fund, or any other financial instrument. The views and strategies discussed herein may not be appropriate and/or suitable for all investors. This material is meant solely for informational purposes, and is not intended to suffice as any type of accounting, legal, tax, or estate planning advice. Any and all forecasts mentioned are for illustrative purposes only and should not be interpreted as investment recommendations.