FIXED INCOME REVIEW & OUTLOOK

2018 Review

2018 will be remembered as the year that volatility returned with a vengeance and investors began to remember that markets could go down as well as up.  It was quite a rollercoaster early on as stocks dropped precipitously in February, rallied all the way back  in March only to drop again by the end of March.  Then tech took over and pushed the markets to new all time highs in September only to become very ugly again in October.  We went from the “synchronized global growth” rally  cry by the pundits in January to “it’s the end of the bull market – a recession is imminent” by October.  There were many factors at play from rising interest rates, political turmoil and trade wars.  By the fourth quarter we finally heard the “imminent credit crisis” drum beating throughout the financial media – something we have been warning about since the inception of this newsletter. The table below shows key indexes, rates and spreads for 2018.

INDEX 2018 OPEN 2018 HIGH 2018 LOW 12/19/2018 CHANGE
Dow Jones 24,719 26,828 23,294 24,527 -5.69%
Nasdaq 6,903 8,109 6,594 7,098 -4.40%
S&P 2,673 2,930 2,523 2,651 -5.55%
Barclays Agg Bond Index 2,046 2,042 1,986 2,025 -0.48%
10 Year Treasury 2.40% 3.23% 2.40% 2.75% +35 bps
Fed Funds 1.40% 2.19% 1.40% 2.19% +79 bps
High Yield Spreads 3.55% 4.56% 3.16% 4.56% +111 bps
IG Spreads 0.98% 1.52% 0.90% 1.52% +54 bps

Looking at this table it should be obvious that in 2018 stock investors suffered a lot of anxiety and essentially and were down approximately 5% on all three major indexes as of the writing (12/19/28).   Nervous investors were logging in daily to check their account balances only to find on some days they were down 2%, 3% or even 5% or more in a day.   In October and November alone the Dow closed up or down 5% or more SIX times (not counting inter-day moves which would have made it many more).  Through November 90% of all asset classes had negative returns for the year, the third highest in history behind only 1901 and 1920.  We are finally beginning to feel the effects of the unprecedented asset manipulation by global central banks and the truth is we are in unchartered waters and while it is anyone’s guess as to how this will end we can certainly use common sense to make some educated predictions (and we will later in this article)


NEXT PAGE : INTEREST RATE REVIEW


INTEREST RATE REVIEW & OUTLOOK

INTEREST RATES

Bond investors fared quite a bit better than stock investors in 2018 ending essentially flat for the year.

The 10-year treasury opened the year right at 2.40% and rose to nearly 3.0% for the first time since 2014 by March. Interest rates tracked the volatility in the stock market for much of the year rising to 3.23% in September before plummeting to 2.85% as the stock market moved into correction territory.  Investors began the year believing that the Fed could engineer a soft landing and would be raising the Fed Funds rate 3 times in 2018 and at least 3 times in 2019.  After the market carnage in the fourth quarter the debate quickly became whether the Fed should raise at all – estimates for Fed Funds rate hikes quickly went from 3 hikes in 2019 to 1 by many economist.  The consensus for where the 10-year treasury would be in 2019 moved from 3.53% to 3.29% with many credible analyst believing it could end up below 3% next year.  It is our current view that the current rally in bonds (lower rates) is over-done in the short run and we could see a quick move back over 3% in the first quarter of 2019.  The Fed will likely hike the Fed Funds rate in December, after that it is a fools game to guess what 2019 brings.  There are multiple macroeconomic factors at play that could not only cause the Fed to pause but to actually begin to cut rates again by late 2019 or early 2020.  We will discuss these events later in this newsletter.


NEXT PAGE: THE YIELD CURVE

 
THE YIELD CURVE

THE YIELD CURVE

As our regular readers know, the yield curve is the difference in the term structure of interest rates – the difference between long and short term rates.  The most commonly quoted yield curve is the 10-year to 2-year treasury curve so we will use it for our discussion.  Generally investors demand a large premium for extending their maturities further in time which is considered a normal yield curve.  When bond investors begin to expect a recession they purchase longer-term bonds (like the 10-year treasury) because they believe the Fed will begin to lower interest rates and they want to lock in the higher yield (and long bonds move in price more than short bonds so when rates fall owning longer maturity bonds gives investors and speculators a higher total return).  As they continue to buy long bonds they send the yield down (remember there is an inverse relationship between price and rates in bonds, higher price = lower rates) and generally at the same time the Fed is raising short-term rates.  This results in an abnormal yield curve which is referred to as an inverted yield curve where short rates pay a higher yield than long term rates.  Below is a 1-year chart of the 10’s to 2’s yield curve.


This chart represents the difference in basis points between the 2-year treasury and the 10-year treasury bond.  We began the year at around 60bps and reached almost 80bps before we began a very quick and steady move lower hitting 11bps in December.  Historically, an inverted yield curve has been a perfect prognosticator of an imminent recession.  Clearly we are moving very quickly toward a possible inversion and we would not be surprised if the curve inverts in the 1st quarter of 2019.

NEXT PAGE: CREDIT SPREADS

 
CREDIT SPREADS

CREDIT SPREADS

Credit spread represents the additional premium bond investors receive above the risk free rate for purchasing bonds that are not guaranteed by the government.  It is useful to look at the difference in spread between the various levels of credit ratings as this gives us a view into investors appetite for risk. We have been warning investors that credit spreads had become too tight and investors were not being rewarded for the risk they were taking and have written extensively about it in our previous newsletters.  Credit spreads tend to move based on volatility in the markets so when you see the Dow drop 1000 points it is likely that spreads have widened (investors are demanding more for purchasing riskier assets).  These 2 charts show the difference between investment grade (IG) and high yield (HY) corporate bonds, the first chart shows 1 year and the second chart shows  this spread going back to 1998.

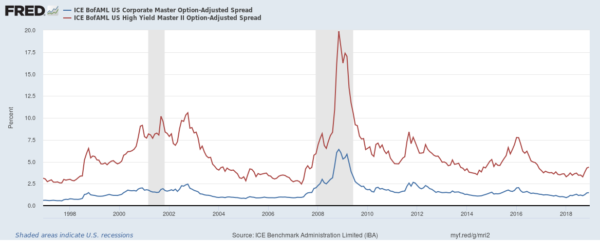
For most of 2018 this spread stayed relatively steady and actually ground to a historically low spread of 209 basis points in September.  This means investors were receiving a mere 2.09% for taking the risk in HY bonds vs. IG bonds.  By December this spread had widened to over 300bps an increase of almost 100bps or 1%.  This spread has historically been between 500 and 600 basis points or an additional 5% to 6% for purchasing HY bonds over IG bonds.  While this 1% move is painful for HY investors (as the spread widens the price of the bond falls) it is nothing compared to the pain we will see if HY spreads move to historical average levels or beyond.  In our October newsletter we discussed credit spreads in some detail and offered an illustration as to what this spread widening means in actual dollar terms for investors.  The takeaway from that analysis was that if credit spreads moved to the lower end of historical average at 500 basis points, an investor with $1 million in bonds would see a price decline of approximately $67,000 on a portfolio of IG bonds vs. a loss of $280,000 on a portfolio of HY bonds.  However, that is if we simply move back to average spreads and during times of stress spreads almost always move far wider than the historical average.


NEXT PAGE: CREDIT SPREADS CONTINUED


CREDIT SPREADS (CONTINUED)

CREDIT SPREADS

On the previous page we looked at a 1-year chart of investment grade (IG) vs. high yield (HY) credit spreads.  Now let’s take a long term view and see what happens to credit spreads during recessions and times of high volatility.

Looking at the long-term chart you can see that HY spreads do not tend to move to the average during times of high stress and volatility but widen far outside the historic average.  In 2002 the spread difference was 863 basis points, in 2008 it hit 1532bps, and as recently as 2016 the spread difference was 647bps.  Remember the spread today has widened to a mere 300bps meaning if the economy starts to head into a recession that the spread is likely to widen significantly.  Many economist and large investors believe we are on the cusp of a coming credit crisis that could be much worse than 2008, especially in the corporate bond market where we are at record levels of high yield and low investment grade debt.

One thing that should jump out immediately from looking at the chart is that IG bonds tend to hold in much better than HY bonds.  If we remove the outlier year of 2008 (credit crisis), IG spreads have never moved beyond 250 basis points (we are low 100’s now).  However, HY spreads have widened to over 800bps three times since 2000.  Now let’s look at various scenarios and what it could mean in real dollar terms to bond investors.  The table below shows the approximate price decline for $1 million in bonds of varying  maturities at different levels of credit spread widening.


+100bps Wider +300bps Wider +600bps Wider +900bps Wider
2-Year Bond -$18,000 -$55,000 -$105,000 -$160,000
5-Year Bond -$50,000 -$130,000 -$240,000 -$330,000
10-Year Bond -$82,000 -$225,000 -$345,000 -$530,000
 
CREDIT SPREADS

CREDIT SPREADS

It is clear looking at the table on the previous page that shorter maturity bonds perform much better than longer maturity bonds when spreads widen (see below for explanation of duration).  This is simply due to the fact that a small price move in a short bond affects the yield more than in a long bond as you are gaining the discounted price over a shorter period of time (for a full explanation please view the material on our website).   Combining the information on the table and the chart on the same page, we can see that if spreads widen dramatically as they have during past recessions investors owning long maturity (10-year+) lower rated (HY) bonds could suffer losses of over 50%.  And that is assuming you held a basket of bonds and doesn’t account for some bonds that will default and could become worthless meaning you could lose your entire investment. As we noted, spreads between HY and IG bonds have moved to over 800bps three times since 2000 so this is not some unrealistic doomsday scenario.  We will discuss the credit bubble later in this piece but there is reason to believe that this next round of spread widening could be more severe than previous cycles and possible rival the 2008 credit crisis where spreads on HY bonds were over 2,000bps.

We have discussed duration in previous newsletters but basically duration is a method of calculating risk in bonds.  For the most part duration is determined by the maturity of a bond – the longer the maturity the higher the duration.  What duration tells us is how much the price of a bond will move given a 1% move in interest rates.  Looking at the table on the previous page you can see that a 2-year bond moves about 1.8%, a 5-year bond moves about 5%, and a 10-year bond declines approximately 8.2% for a 1% (100 basis point) rise in interest rates (or spread widening).

As we noted, spreads on IG bonds tend to hold up far better in recessions and times of high volatility than HY spreads.  Obviously this is due to the fact that as the economy weakens the odds of default on HY bonds increase dramatically.  Corporate bonds are binary in nature which means there are two possible outcomes – either they mature at par and the investor receives their entire principal payment upon maturity or they default pushing the issuer into bankruptcy and leaving bondholders hoping for a recovery through the court system.  The binary nature of corporates is what pushes HY spreads wider so dramatically during recessions.  Investors quickly demand a much larger premium for investing in shakier borrowers that have an exponentially larger chance of default.  This phenomenon is going to be unusually amplified when the next credit event occurs due to the record high levels of HY debt – much of which has been issued by companies that during normal credit cycles would have never been able to issue debt.  Decade long artificially record low interest rates sent investors chasing yield and enabled these companies to issue debt and unreasonably favorable rates and with historically poor debt covenants.

Referring back to the table and again using the information from the graph, we see IG spreads historically move to around 2.5% or about 1% over their current levels.  This means an investor holding short, high quality bonds is risking only 1.8% price decline which would be easily offset by the interest payments received.  Compare that to a short HY investor who is risking $160,000 or more for the same maturity or a price decline of 16% and the  interest received wouldn’t even come close to covering the loss.  Clearly looking at the chart the difference becomes much larger for investors with longer maturity bonds as the HY bond portfolio could suffer losses of over $500,000 (much more if we are correct and spreads widen far more than historical levels would suggest).


NEXT PAGE: THE DEBT BUBBLE

 
THE LOOMING DEBT BUBBLE

THE DEBT BUBBLE

We have been discussing the imminent debt bubble for some time and it appears we are beginning to see it start to play out.  Six months ago almost none of the talking heads were discussing the corporate debt and levered loan market and suddenly it appears to have become a hot topic.  Here are a few bullet points to help set up our discussion.

  1. TOTAL GLOBAL DEBT is a record $247 trillion.  In 2007 total global debt was $150 trillion or about 260% of global GDP.  It is now 327% of global GDP.
  2. U.S. CORPORATE DEBT is $9 trillion. This is an all-time high and about 50% greater than during the credit crisis in 2007.
  3. U.S. CORPORATE DEBT vs. GDP is at an all time high at 46% of GDP.
  4. DEBT QUALITY has deteriorated dramatically. Of the over $6 trillion of investment grade corporate debt, $2.8 trillion is rated BBB (low IG).
  5. HIGH YIELD DEBT is at a record $1.6 trillion with over 15% reportedly operating as zombie companies (not enough cash-flow to service debt).
  6. LEVERED LOAN MARKET has become larger than the HY market with nearly $2 trillion in levered loans on banks balance sheets
  7. CORPORATE DOWNGRADES are on pace to reach their highest level since 2009 with over 900 issuers being downgraded in 2019.
  8. DEALER BALANCE SHEETS have contracted significantly which will reduce liquidity when the next credit event occurs.

A decade of global central bank interference has kept interest rates artificially low for over a decade.  Believe it or not a record amount of this debt has been issued at NEGATIVE interest rates meaning investors are paying the central banks for loaning them money.  With $247 trillion in global debt it doesn’t take a large increase in interest rates to equate to a massive increase in the borrowing cost of the issuers.  A seemingly small increase of 1% would mean issuers would have to pay an additional $2.47 trillion/year to service their debt.

Of major concern is that many of these BBB issuers which are now IG will be downgraded to junk.  Most large institutional investors (insurance companies, banks, money managers, mutual funds, etc.) have very tight legal limits on how much HY paper they can own.  When (not if)  these downgrades occur they will be forced to sell causing a massive liquidity problem as there will be nobody left to purchase these newly rated non-investment grade bonds.  Investors are already fleeing HY bonds in droves with only this minimal drop in price.  This is going to create one of the greatest investment opportunities in a generation for those who have the ability to take advantage of this liquidity crunch (investors with cash).

We saw this phenomenon during the credit crisis where the lack of liquidity allowed astute investors to swoop in and purchase mortgage-backed securities for pennies on the dollar from the forced sellers and generate astounding returns.  The other problem is that due to new reporting rules dealers are less inclined to purchase bonds for their balance sheets (inventory) which will further reduce liquidity.  Again, we saw this in the credit crisis – the very broker-dealers that would usually step in to buy the bonds at fire sale prices and provide order and liquidity were being forced to sell themselves.  There was no natural buyers and MBS bonds fell to prices that were far below their actual value.  Now let’s tie all of this together and see what it could mean for 2019.


NEXT PAGE: VOLATILITY OUTLOOK 2019

 
Volatility Outlook 2019

2019 VOLATILITY EVENTS

So far we have discussed interest rates, the yield curve, credit spreads and the debt markets.  It is important to understand that each of these topics are inter-related, with changes in one affecting the other and there are several ways this could play out and almost none of them are good for investors.  In 2019 we expect the volatility to continue and likely worsen as the year progresses.  There are multiple potential trigger events at play -below is a list of just a few that investors should be following closely that could impact the markets in 2019 with the potential to become major volatility events.

  1. BREXIT – It seems nobody can agree on how the Brexit deal will play out and it seems to get more confusing every day.  What is certain is that as long as the question looms and uncertainty remains the Brexit mess will continue to be a high volatility headline.
  2. TRADE WARS – It has been decades since we have experienced a true trade war but the difference this time is the economic muscle and political fortitude of our opponent.  The Chinese do not enjoy being pushed around and have little concern for the cost to their citizens.
  3. GLOBAL GROWTH – Growth is slowing rapidly around the world.  Several countries who had previously begun a policy of monetary tightening have changed their stance, in the last few months over $2 trillion has been added to negative interest rate debt – a reversal from just  a few months ago.
  4. POLITICAL TURMOIL – Clearly there is political uncertainty at home with President Trump under constant attack and as the Democrats take power in the house it is almost a certainty that the rhetoric will heat up even more in 2019.  As bad as it seems at home, much of the world is in complete chaos as we see riots in France, the UK fight over Brexit, deep problems throughout much of Latin America, a populist government in Italy just to name a few.  There is also fears of “flash conflicts” with some major military powers as China flexes it’s naval muscle and Russia builds its troop strenght on western European borders and has announced plans to build a military base in the Caribbean.
  5. DEBT TSUNAMI – We have discussed the corporate bond market in this newsletter but debt in all sectors could present problems.  Consumer debt of all types has reached record levels and eventually this will have to lead to a slow down in consumer spending thus affecting the economic outlook for growth.
  6. INTEREST RATES – At this point it is unclear what the Fed will do in 2019 and it will likely depend on how the above listed events unfold throughout the year.  Estimates for the number of Fed hikes in 2019 have dropped dramatically.  We believe they will likely raise one more time in 2019 and even that hike will only be to give them some room to lower once the economy turns.
  7. OIL PRICES – Falling oil prices carry risk of their own as many countries derive much of their revenue from oil production.  Saudi Arabia is already experiencing political turmoil and needs the oil revenue to control the population.  Russia derives most of its revenue from oil and has shown it is willing to risk global political instability to prop up oil prices and maintain the control within the ruling class.

These are just a few factors that investors should be following as potential catalyst for major market turmoil in 2019. All of these events have the ability to spike volatility to levels that would trigger massive spread widening.  The Fed is walking a thin line on interest rates – raise too much and the economy slows, not enough they risk inflation.  The massive wall of debt coming due coupled with a wave of downgrades and defaults could trigger a liquidity crunch pushing credit spreads wider causing the Fed to quickly lower rates than to fight the flailing stock market and economy.  In our opinion, the credit markets are the key.  Whatever the catalyst, widening credit spreads have the ability to bring the entire house of cards crumbling.  One thing should be very clear to readers – there is a massive amount of risk in the system at this point and investors should position their portfolio accordingly. For fixed income investors this means positioning your portfolio in a way that takes advantage of the flat (and likely inverting) yield curve, and reducing risk by shortening maturities (duration) and most importantly reducing credit risk by moving up in quality.

NEXT PAGE: NAVIGATING THE VOLATILITY 


NAVIGATING VOLATILITY IN 2019

2019 VOLATILITY OUTLOOK

We are sitting at an unprecedented point in economic history as we are coming to the end of the largest monetary experiment in history. Global central banks have moved to artificially inflate nearly every asset class by keeping rates at historically low levels for an historically long period while simultaneously purchasing stocks and bonds at levels never before seen in human history. As we illustrated there are also numerous major events that must be carefully navigated this year and of course there is always the “black swan” hiding in the shadows that nobody sees coming.  What could go wrong? The answer is nobody knows but based on any sound economic theory common sense should tell you this will not end well and the magnitude could be far greater than anything we have seen in previous downturns.

Diehard stock investors would be wise to proceed with caution and rotate into higher quality names with solid balance sheets.  If you simply must own riskier growth stocks with little or no free cash-flow and high price to earnings ratios you would be wise to hedge the positions using options.

It amazes us how often we hear the experts on CNBC saying something ridiculous like “why would anyone buy fixed income when bonds are paying 3% for 10-years” as if the only 2 choices are purchasing risky stocks or buying 10-year treasuries at 3%.  As rates have risen and spreads have widened fixed income investors can now purchase high quality short and intermediate bonds at yields that are far above the inflation rate and that carry very little risk. High quality 2-3 year bonds can now be purchased with yields well over 4% and as we demonstrated on pages 5 and 6 of this newsletter even if spreads widened 100 basis points and rates also rose 100 basis points the interest payments would be enough to offset any price declines.  These short maturity bonds would also give investors money to re-invest at the higher yields and wider spreads.  We believe it is highly likely that in the next 12-24 months investors will have the opportunity to lock in extremely attractive yields, likely at least double todays rates and if the credit crisis we expect happens possibly much more.

Several large and respected hedge fund managers have called for 40%+ declines in the stock markets.  The reality is that is not an unreasonable assumption when you keep in perspective how far we have moved up in a short period of time.  Many analyst have come out with 10-year projections calling for the stock market to average 3% to 5% over the next decade.  Investors should ask themselves if the risk/reward is worth it – is it worth a possible 40%+ loss to earn a possible 5%?

In our opinion we are entering a cycle where bonds will be offering equity like returns with a fraction of the risk. During the 2007 credit crisis investors were able to purchase long maturity IG bonds and lock in double digit yields and we believe this type of scenario is being set up today.

NEXT PAGE: SUMMARY

 
SUMMARY

SUMMARY

The great economic experiment that grew out of the 2007 credit crisis is winding down and no matter what they tell you nobody knows how this will end.  Nearly every economic principle has been turned on its head for the last 10 years and the results have continued to confound most people with a modicum of common sense.  Economic theory would tell you that printing, borrowing, and spending such massive amounts of money would result in rampant inflation yet the only thing that has been inflated are asset prices (stocks, bonds, housing).  In 2018 we began talking about QUADRILLIONS in global debt.  There is a massive decrease in credit quality and increase in corporate defaults.  In 2018 we faced trade wars, interest rate hikes, slowing growth, and many other geo-political nightmares and the result was one of the most volatile years in history.

If 2018 made you nervous then you better buckle up for 2019 as we expect the volatility to continue and likely worsen as we inch closer to the debt bubble busting.  It is likely the yield curve will invert in 2019, a phenomenon that has been a perfect predictor of an imminent recession.  With Democrats controlling the house you can be sure that the political atmosphere at home will be rocky at best as it seems for most elected Democrats their #1 agenda is to destroy Trump.  Historically low credit spreads will continue their widening probably getting close to historical averages by the end of 2019.  We demonstrated that this would lead to massive losses for stock investors and bond investors that do not heed our warning and shorten their duration and increase their credit quality.  It is likely that the current conditions are overdone in the short-term and we could see some calming in the markets in the first quarter. Investors should begin to de-risk and de-leverage immediately and stubborn investors who refuse to take a loss should take advantage of any such relief in the markets to sell risky assets.

The flat yield curve and tight credit spreads mean investors are not getting paid for taking term and credit risk and income portfolios should be positioned to weather the current storm and coming tsunami.  Our portfolios have substantially outperformed not only the bond indexes but also stocks in 2018.  By purchasing short maturity, high quality bonds with heavy principal cash-flows investors can position themselves to take advantage of the coming spread widening and will likely be able to lock in yields that have not been seen in a decade.  Fixed income investors have become used to earning their measly 3%-4% returns over the last decade – if our spread widening prediction is correct investors will be able to lock in yields of 3-4 times that over the next 12-24 months.

We significantly outperformed all major bond indexes as well as the stock market by utilizing this short duration high quality strategy in 2018.  Any increase in volatility will only make this strategy more attractive as liquidity continues to erode and we are able to purchase bonds at significant discounts to their actual market value.  In November and December we have been able to re-invest our cash-flows into very short-term securities with yields well over 5% (even double digits on the more volatile days). Considering 90% of all asset classes are down for the year, 5%+ on short, low risk, investment grade cash substitutes seems like a gift.

Please feel free to contact us with questions about this report or for a free bond risk evaluation.

Have a Fantastic 2019,

David D Dellinger

702-492-1243

david@advancedincomesolutions.net